
Kopya ticareti için hizmet. Algo'muz işlemleri otomatik olarak açar ve kapatır.
L2T Algo, minimum riskle oldukça karlı sinyaller sağlar.
24/7 kripto para ticareti. Siz uyurken biz ticaret yaparız.
Önemli avantajlarla 10 dakikalık kurulum. Kılavuz, satın alma işlemiyle birlikte verilir.
%79 Başarı oranı. Sonuçlarımız sizi heyecanlandıracak.
Ayda en fazla 70 işlem. 5'ten fazla çift mevcuttur.
Aylık abonelikler £ 58'den başlar.
BNBUSD Fiyat Analizi – 15 Ocak
In case the sellers were able to push the price below the support level of $37 and the daily candlestick close below the level, then, the price may decline further to test the $31 and $27 support level. Inability to break down the support level of $37, the bullish trend may continue to target the resistance levels at $41, $44, and $48.
GBP / JPY Pazarı
Anahtar seviyeler:
Tedarik seviyeleri: 41 $, 44 $, 48 $
Talep seviyeleri: 37 $, 31 $, 27 $
BNBUSD Uzun vadeli trend: Boğa
The bulls return to the BNBUSD market after price retracement. In other words, BNB is bullish in the long-term outlook. On December 19, the bulls take over the market by breaking up the resistance level of $31. The price soars towards the resistance level of $44 after it breaks up the resistance levels of $37 and $41. The price pulled back to retest the broken level of $31. The bulls are taken over the BNBUSD market at the moment.
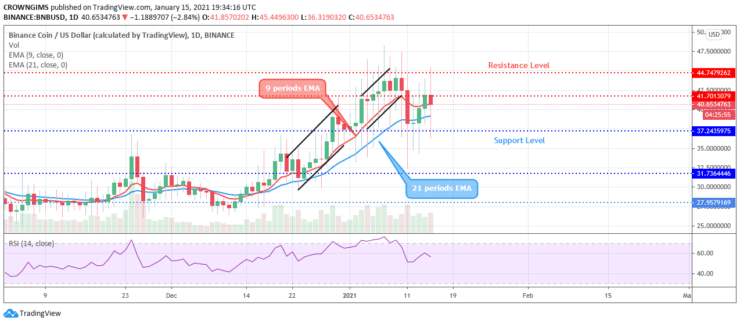
The price has retested the dynamic support levels of 21 periods EMA and the 9 periods EMA and the coin is trading above the two EMAs at the close range which connotes the gradual increase of the bulls’ momentum. The Relative Strength Index period 14 is at 60 levels with the signal lines pointing down to indicate a sell signal which may be a pullback. In case the sellers were able to push the price below the support level of $37 and the daily candlestick close below the level, then, the price may decline further to test the $31 and $27 support level. Inability to break down the support level of $37, the bullish trend may continue to target the resistance levels at $41, $44, and $48.
BNBUSD orta vadeli Trend: Düşüş
BNBUSD is bearish in the 4-hour chart. Last week. The coin tested the resistance level of $44 on January 10 but there is no enough pressure to penetrate the level. A bearish engulfing candle emerges; which indicates an increase in the bears’ momentum. The price descends and tested the support level of $36. The Crypto bounces and increases to test the $41 price level. The price may continue its bearish movement.
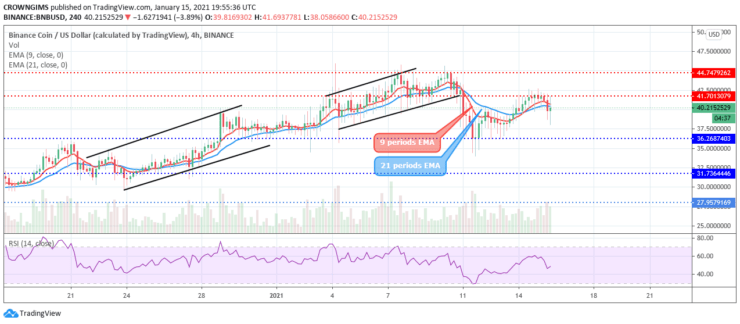
The 9 periods EMA is trying to cross the 21 periods EMA downside while the coin is trading below the two EMAs which connotes a decrease in the bulls’ momentum. The RSI indicator period 14 is above 40 levels and the signal lines bending up to indicate a buy signal.
- komisyoncu
- Min Mevduat
- Puan
- Broker'ı ziyaret et

- Ödüllü Cryptocurrency ticaret platformu
- Minimum 100 $ depozito,
- FCA ve Cysec düzenlenmiştir

- 20 $ 'a kadar% 10,000 hoşgeldin bonusu
- Minimum para yatırma miktarı $ 100
- Bonus yatırılmadan önce hesabınızı doğrulayın

- 100'den fazla farklı finansal ürün
- 10 $ 'a kadar yatırım yapın
- Aynı gün para çekme mümkündür
- Minimum 250$ ile Moneta Markets hesabına para yatırın
- % 50 para yatırma bonusunuzu talep etmek için formu kullanmayı seçin