
Kopya ticareti için hizmet. Algo'muz işlemleri otomatik olarak açar ve kapatır.
L2T Algo, minimum riskle oldukça karlı sinyaller sağlar.
24/7 kripto para ticareti. Siz uyurken biz ticaret yaparız.
Önemli avantajlarla 10 dakikalık kurulum. Kılavuz, satın alma işlemiyle birlikte verilir.
%79 Başarı oranı. Sonuçlarımız sizi heyecanlandıracak.
Ayda en fazla 70 işlem. 5'ten fazla çift mevcuttur.
Aylık abonelikler £ 58'den başlar.
NEO Fiyat Analizi – 28 Aralık
An increase in the bulls’ pressure may lead to a breakout at the resistance level of $19 which may push the price to $22 and $25 price level. Likewise, the breakdown of the $15 price level will reduce the price to $13 and $12 price level.
NEO / USD Pazarı
Anahtar Seviyeleri:
Direnç seviyeleri: $ 19, $ 22, $ 25
Destek seviyeleri: $ 15, $ 13, $ 12
NEO/USD Monthly Trend – Bullish
NEOUSD is bullish in the monthly chart. The bulls dominate the NEO market in 2020. The price was found at the support level of $12 in January; the price was ranging within the $12 and $13 price level. The bulls were able to push the pair out of this ranging mode in July. There was a further increase in the bulls’ momentum and the price increased accordingly with the formation of a strong and massive bullish candle in August. The high of the year was found at the resistance level of $25. The bulls’ momentum failed and the bears push down the coin to test the $15 price level.
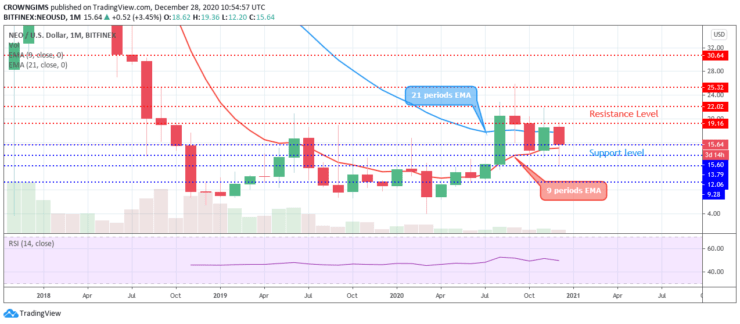
The price decrease could be a pullback to the coin; that is, it may resume a bullish trend in 2021. The crypto is trading in between the 9 periods EMA and 21 periods EMA which indicates that the market is not trending at moment. An increase in the bulls’ pressure may lead to a breakout at the resistance level of $19 which may push the price to $22 and $25 price level. Likewise, the breakdown of the $15 price level will reduce the price to $13 and $12 price level.
NEO/USD Orta Vadeli Trend – Düşüş
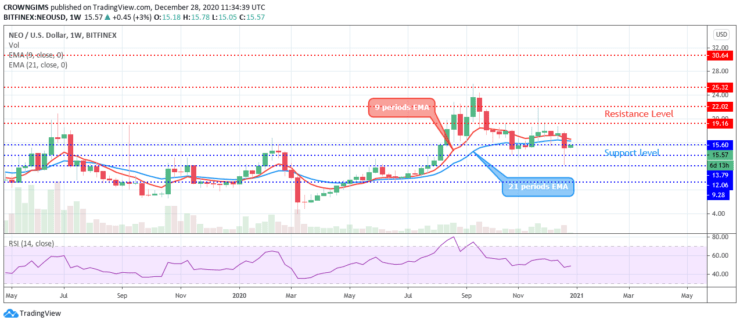
NEOUSD is bearish on the 4-hour chart. The buyers tried their best by pushing up the coin to the resistance level of $25 on September 14. The bears opposed the bullish movement at the same level; the price decreased and tests the $15 support level. The coin is currently ranging within the $19 and $15 price level.The 9 periods EMA is close to 21 periods EMA and the price is hovering over the two EMAs which indicates that the bears’ momentum and the bulls’ momentum are low. The relative strength index period 14 is bending up above 40 levels to indicate a buy signal.
- komisyoncu
- Min Mevduat
- Puan
- Broker'ı ziyaret et

- Ödüllü Cryptocurrency ticaret platformu
- Minimum 100 $ depozito,
- FCA ve Cysec düzenlenmiştir

- 20 $ 'a kadar% 10,000 hoşgeldin bonusu
- Minimum para yatırma miktarı $ 100
- Bonus yatırılmadan önce hesabınızı doğrulayın

- 100'den fazla farklı finansal ürün
- 10 $ 'a kadar yatırım yapın
- Aynı gün para çekme mümkündür
- Minimum 250$ ile Moneta Markets hesabına para yatırın
- % 50 para yatırma bonusunuzu talep etmek için formu kullanmayı seçin