
Kopya ticareti için hizmet. Algo'muz işlemleri otomatik olarak açar ve kapatır.
L2T Algo, minimum riskle oldukça karlı sinyaller sağlar.
24/7 kripto para ticareti. Siz uyurken biz ticaret yaparız.
Önemli avantajlarla 10 dakikalık kurulum. Kılavuz, satın alma işlemiyle birlikte verilir.
%79 Başarı oranı. Sonuçlarımız sizi heyecanlandıracak.
Ayda en fazla 70 işlem. 5'ten fazla çift mevcuttur.
Aylık abonelikler £ 58'den başlar.
ADA Fiyat Analizi - 20 Ekim
Should the price test the resistance level at $0.11 and the daily candle close above it, then, $0.13 and $0.14 resistance levels may be tested. The inability to break up the $0.11 level by the bulls may trigger the bears to take over the ADA market.
ADA / USD Pazarı
Anahtar Seviyeleri:
Direnç seviyeleri: $ 0.11, $ 0.13, $ 0.14
Destek seviyeleri: $ 0.10, $ 0.08, $ 0.07
ADA / USD Uzun Vadeli Trend: Boğa
The bulls are maintaining their bullish position in the ADA market. There are low volatility and low bullish momentum and that is why there was no significant difference in the last week’s market. ADA price observed a price retracement towards the dynamic support levels, the level prevents further price reduction. The price is slowly increasing towards the resistance level of $0.11.
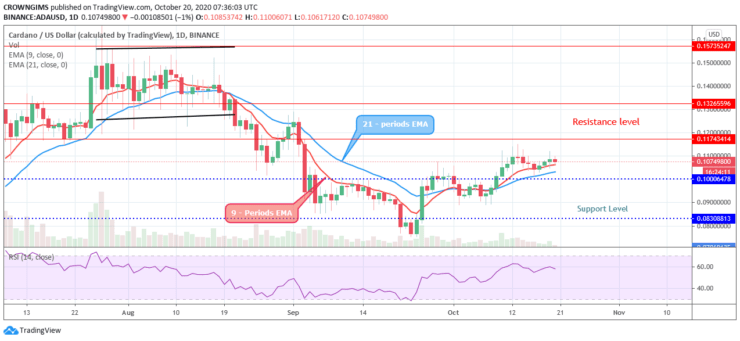
Cardano price continues trading above the 9 periods EMA and 21 periods EMA as a symbol of the bullish movement. The bulls may dominate the ADA market further as the moving averages are steep at an angle of 45 degrees with the formation of bullish candles. Should the price test the resistance level at $0.11 and the daily candle close above it, then, $0.13 and $0.14 resistance levels may be tested. The inability to break up the $0.11 level by the bulls may trigger the bears to take over the ADA market. Meanwhile, the relative strength index period 14 is at 60 levels and the signal line pointing down to indicate sell signal.
ADA / USD Orta Vadeli Trend: Boğa
ADA/USD is bullish on the 4-hour chart. After the breakup of the $0.10 resistance level, the price steadily increases towards the $0.11 resistance level. The price pulls back to the dynamic support level and it is consolidating around the dynamic levels.
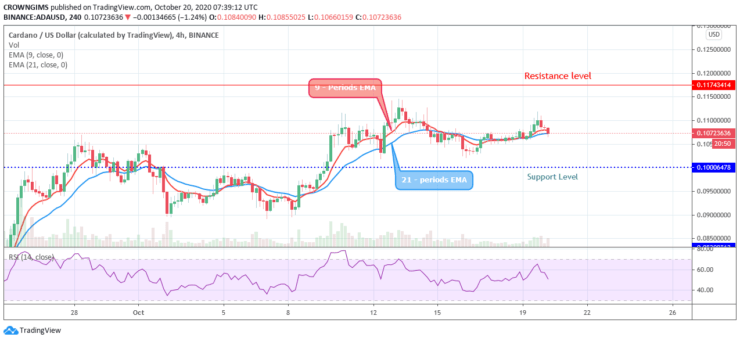
The Relative Strength Index period 14 with its signal line at 50 levels bending down to indicate sell signal. The price may increase further after the pullback.
- komisyoncu
- Min Mevduat
- Puan
- Broker'ı ziyaret et

- Ödüllü Cryptocurrency ticaret platformu
- Minimum 100 $ depozito,
- FCA ve Cysec düzenlenmiştir

- 20 $ 'a kadar% 10,000 hoşgeldin bonusu
- Minimum para yatırma miktarı $ 100
- Bonus yatırılmadan önce hesabınızı doğrulayın

- 100'den fazla farklı finansal ürün
- 10 $ 'a kadar yatırım yapın
- Aynı gün para çekme mümkündür
- Minimum 250$ ile Moneta Markets hesabına para yatırın
- % 50 para yatırma bonusunuzu talep etmek için formu kullanmayı seçin