
Сервис за трговину копирањем. Наш Алго аутоматски отвара и затвара трговине.
Л2Т Алго пружа високо профитабилне сигнале са минималним ризиком.
24/7 трговање криптовалутама. Док ти спаваш, ми тргујемо.
Подешавање од 10 минута са значајним предностима. Упутство се добија уз куповину.
79% Стопа успешности. Наши резултати ће вас одушевити.
До 70 трговина месечно. На располагању је више од 5 парова.
Месечне претплате почињу од 58 фунти.
Кључне зоне за подршку: 7 000, 6 000, 5,000 XNUMX УСД
КТУМ/УСД Дугорочни тренд: биковски
Qtum is in an upward move after breaking the downtrend line. In retrospect, the pair has been in a bear market since June 29, 2019. In June, Qtum was in a bull market; the bulls have taken price to the high of $5.50 but were resisted. Unfortunately, as the buyers could not penetrate the resistance, the coin was compelled to a downward move. The first bearish impulse was at a low of $2.67. The price made a pullback to the resistance at $3.0.
After retesting the resistance, the downward move continued to a low of $1.50. The bulls defended the support at $1.50 as the pair resumed a sideways trend. Later the bulls have the upper hand as the downtrend line was broken. Interestingly, as the downtrend line was broken, the upward move resumed. The coin reached a high of $3.0 but was resisted. On the downside, if the price falls to the low of $2.50, the upward move may resume.
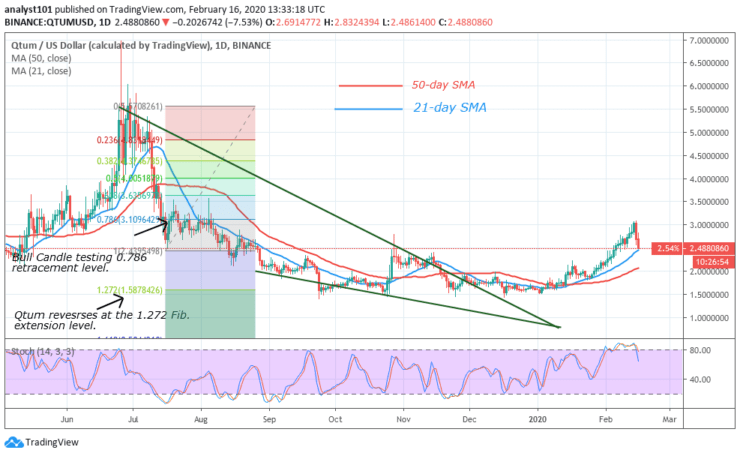
Читање индикатора дневног графикона:
Qtum is below 80% range of the daily stochastic. It means that the coin is in bearish momentum. Meanwhile, a Fibonacci tool was drawn to determine the selling pressure. A bull candle tested the 0.786 retracement level which indicates the coin is likely to reverse at the 1.272 Fibonacci extension level.
КТУМ/УСД Средњорочни тренд: биковски
On the 4-hour chart, Qtum is in a smooth uptrend as the market reached a high of $3.0. The bulls tested the resistance at $3 twice but were unable to penetrate it. In the process of time, a bearish double top was formed. The pattern resulted in a downward move.
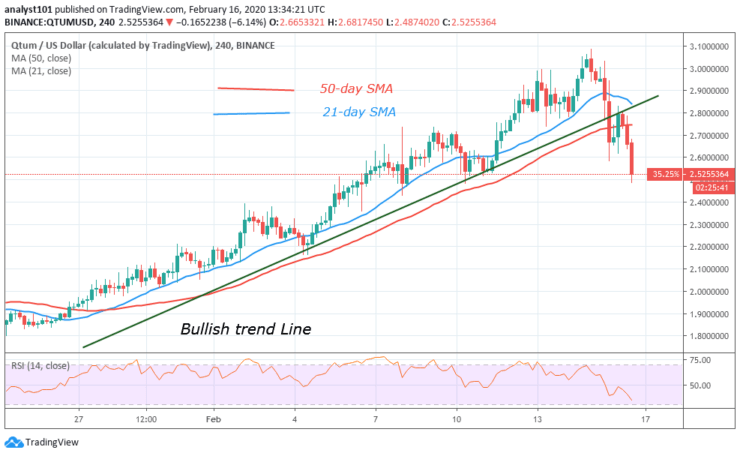
4-часовно очитавање индикатора графикона
The Relative Strength Index period 14 level 40 indicates that the coin is in the downtrend zone. It is also below the centerline 50 which indicates that the coin is likely to fall. As the price broke below the bullish trend line, a retest was made which resulted in the downward move. It is expected that the downward move will reach a low of $2.50.
General Outlook for Bitcoin (QTUM)
Qtum is in a downward move. It is anticipated that if price retraces to the support of the 21-day SMA, an upward move will resume. Conversely, if price breaks below the SMAs, the downtrend will resume.
КТУМ трговачки сигнал
Инструмент: КТУМ/УСД
Поруџбина: Купи ограничење
Цена улаза: 2.50 УСД
Стоп: 2.10 УСД
Циљ: $ КСНУМКС
Белешка: Леарн2Траде.цом није финансијски саветник. Истражите пре него што уложите средства у било коју финансијску имовину или представљени производ или догађај. Нисмо одговорни за ваше резултате улагања
- Брокер
- Мин депозит
- Скор
- Посетите Брокер

- Награђивана платформа за трговање криптовалутама
- Минимални депозит 100 УСД,
- ФЦА и Цисец регулисани

- Бонус добродошлице од 20% до 10,000 УСД
- Минимални депозит $ КСНУМКС
- Верификујте свој рачун пре него што се бонус додели

- Преко 100 различитих финансијских производа
- Уложите већ од 10 долара
- Могуће је повлачење истог дана
- Рачун Фонда Монета Маркетс са минимално 250 УСД
- Одлучите се да користите образац да бисте затражили бонус од 50% на депозит