
Сервис за трговину копирањем. Наш Алго аутоматски отвара и затвара трговине.
Л2Т Алго пружа високо профитабилне сигнале са минималним ризиком.
24/7 трговање криптовалутама. Док ти спаваш, ми тргујемо.
Подешавање од 10 минута са значајним предностима. Упутство се добија уз куповину.
79% Стопа успешности. Наши резултати ће вас одушевити.
До 70 трговина месечно. На располагању је више од 5 парова.
Месечне претплате почињу од 58 фунти.
НЗДУСД Анализа цена - 12. септембар
NZDUSD will continue to fall as the price keeps making a downward movement. The price retested the 0.71620 resistance zone before bouncing back to the 0.70740 support zone. There appears to be a bullish rejection as the price continues to respond to the 0.71620 key level. Sellers have now stepped in to take the price downward. The market is expected to reach the key level of 0.70740 before breaking past it.
НЗДУСД значајни нивои
Нивои отпора: 0.73160, 0.72070, 0.71620
Нивои подршке: 0.70740, 0.69000, 0.68000
 НЗДУСД Дугорочни тренд: Медвједаст
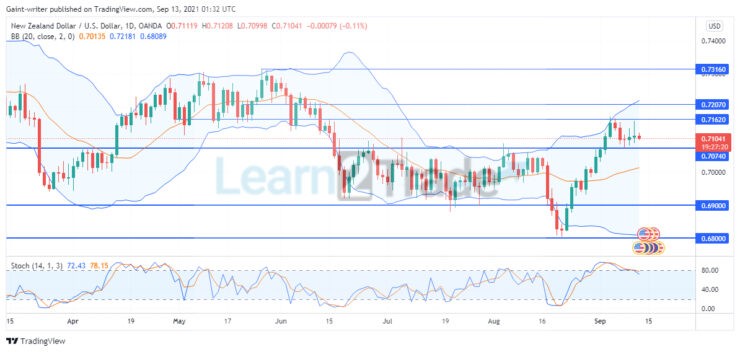 НЗДУСД Дугорочни тренд: Медвједаст
The NZDUSD market began consolidating as there appears to be price reluctance. Before the consolidation period, the price initially broke through the key level of 0.70740. However, the price reached its greatest high of 0.73160 before resuming its downward trend. As the market continues to fall precipitously, there appears to be a big pullback around the 0.72070 and 0.71620 key levels before reaching the 0.69000 support level.
However, a reversal happened at this level, and the market subsequently ranged between 0.70740 and 0.69000 important key levels before falling lower to 0.68000 significant key levels. The market subsequently had a bullish recovery, rallying back to 0.71620, but is now set to resume falling. As the Stochastic Oscillator indicator indicates a golden cross around 80.00, the price movement is likely to return to 0.70740, which will push the price into the overbought region. This indicates that the sellers are now in ascendancy.
НЗДУСД Краткорочни тренд: Медвједаст
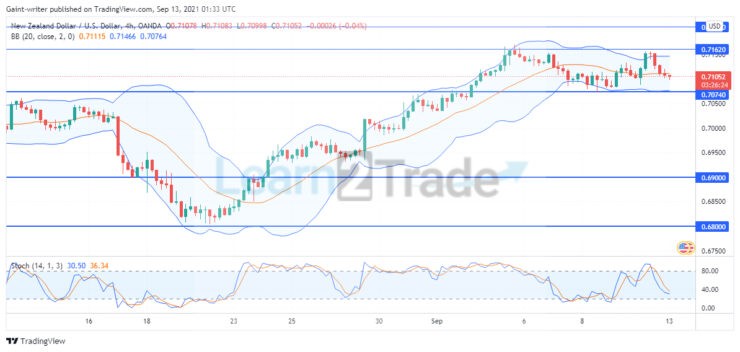 НЗДУСД Краткорочни тренд: Медвједаст
On the 4-hour chart, the price is shown ranging after a bullish rise with higher lows and highs. The Bollinger Band depicts price movement along with the middle band when the price is expected to fall. The Stochastic Oscillator indicator also shows price falling as it approaches the 0.70740 critical level.
Крипто кованице можете купити овде: Купи жетоне
Белешка: Леарн2.траде није финансијски саветник. Урадите истраживање пре него што уложите средства у било који финансијски капитал или представљени производ или догађај. Нисмо одговорни за ваше резултате улагања.
- Брокер
- Мин депозит
- Скор
- Посетите Брокер

- Награђивана платформа за трговање криптовалутама
- Минимални депозит 100 УСД,
- ФЦА и Цисец регулисани

- Бонус добродошлице од 20% до 10,000 УСД
- Минимални депозит $ КСНУМКС
- Верификујте свој рачун пре него што се бонус додели

- Преко 100 различитих финансијских производа
- Уложите већ од 10 долара
- Могуће је повлачење истог дана
- Рачун Фонда Монета Маркетс са минимално 250 УСД
- Одлучите се да користите образац да бисте затражили бонус од 50% на депозит