
Сервис за трговину копирањем. Наш Алго аутоматски отвара и затвара трговине.
Л2Т Алго пружа високо профитабилне сигнале са минималним ризиком.
24/7 трговање криптовалутама. Док ти спаваш, ми тргујемо.
Подешавање од 10 минута са значајним предностима. Упутство се добија уз куповину.
79% Стопа успешности. Наши резултати ће вас одушевити.
До 70 трговина месечно. На располагању је више од 5 парова.
Месечне претплате почињу од 58 фунти.
NEO Price Analysis – February 08
A further increase in the bears’ pressure may penetrate the two dynamic support level downside and decrease to $22 price level, it may extend to $19 and $15 levels. Bullish movement may continue in case the price could not break down dynamic support level and the resistance above the current price is found at $25, $28 and $32.
НЕО / УСД тржиште
Нивои кључева:
Нивои отпора: 25, 28, 32 и XNUMX долара
Нивои подршке: 22 УСД, 19 УСД, 15 УСД
НЕО / УСД Дугорочни тренд - медведаст
NEOUSD is bearish in the daily chart. The price action has formed a short “M” pattern; the chart pattern formed is a bearish signal pattern. It means there is tendency for the NEO to fall to previous low at $15 provided the bears intensify their pressure. The price is currently descending below the $25 resistance level.
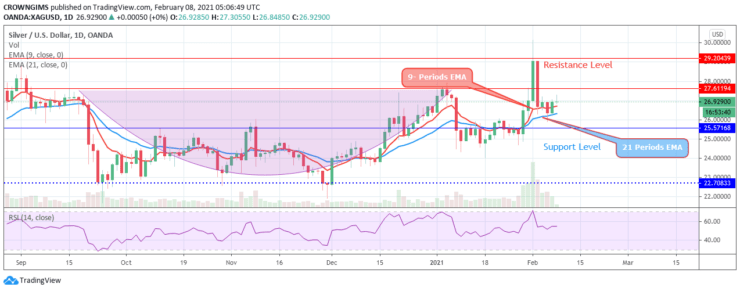
The two EMAs are separated from each other and the coin is trading above the 9 periods EMA and 21 periods EMA at close range. A further increase in the bears’ pressure may penetrate the two dynamic support level downside and decrease to $22 price level, it may extend to $19 and $15 levels. Bullish movement may continue in case the price could not break down dynamic support level and the resistance above the current price is found at $25, $28 and $32.
НЕО / УСД Средњорочни тренд - Медведаст
The bears are prevailing over the bulls. The bulls’ momentum and the bears’ momentum were equal last week on the 4-hour chart. The price initially rise after the consolidation towards the resistance level at $25. There was a partial breakout at the mentioned level on February 05. at equilibrium in the 4-hour chart. A “Tweezer top” candle pattern appeared, the bearish movement continues below the dynamic support level.
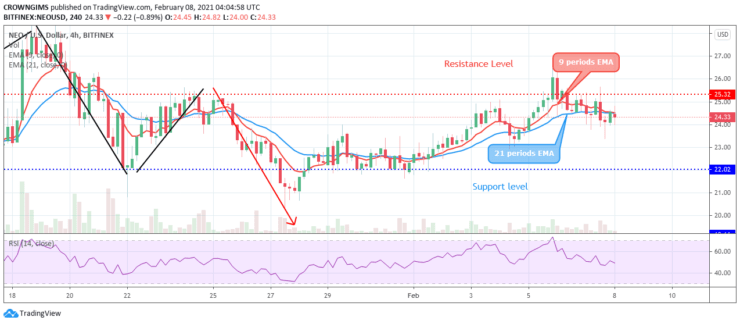
The price is crossing the 9 periods EMA and 21 periods EMA downside. The relative strength index period 14 is displaying a bearish signal at 50 levels.
- Брокер
- Мин депозит
- Скор
- Посетите Брокер

- Награђивана платформа за трговање криптовалутама
- Минимални депозит 100 УСД,
- ФЦА и Цисец регулисани

- Бонус добродошлице од 20% до 10,000 УСД
- Минимални депозит $ КСНУМКС
- Верификујте свој рачун пре него што се бонус додели

- Преко 100 различитих финансијских производа
- Уложите већ од 10 долара
- Могуће је повлачење истог дана
- Рачун Фонда Монета Маркетс са минимално 250 УСД
- Одлучите се да користите образац да бисте затражили бонус од 50% на депозит