Služba obchodovania s kópiami. Naše Algo automaticky otvára a zatvára obchody.
L2T Algo poskytuje vysoko ziskové signály s minimálnym rizikom.
24/7 obchodovanie s kryptomenami. Kým vy spíte, obchodujeme.
10-minútové nastavenie s podstatnými výhodami. Návod je dodávaný pri kúpe.
79% úspešnosť. Naše výsledky vás nadchnú.
Až 70 obchodov mesačne. K dispozícii je viac ako 5 párov.
Mesačné predplatné začína na 58 £.
Horizontal Levels is one of the simplest yet incredibly useful ideas in Forex trading. Horizontal levels are fundamental in most Forex trading strategies and aid us in analyzing charts. However, they can also be used on their own as a strategy rather than just a tool for other strategies. By watching the most obvious price changes and drawing their horizontal levels we can make successful trades. In fully understanding the horizontal levels of more complex charts we can spot trends that we would have otherwise missed.
4
Spôsob platby
Obchodné platformy
Regulované podľa
Podpora
Min.záloha
Pákový efekt max
menových párov
Klasifikácia
Mobile App
hodnotenie
Celkové náklady
$ 0
![]() Provízie
3.5
Provízie
3.5
Min.záloha
$100
Roztierajte min.
Pips premenných
Pákový efekt max
100
menových párov
40
Obchodné platformy
Metódy financovania


Regulované podľa
FCA
Čo môžete obchodovať
forex
Indexy
Akcia
Cryptocurrencies
suroviny
Priemerné rozpätie
EUR / GBP
-
EUR / USD
-
EUR / JPY
0.3
EUR / CHF
0.2
GBP / USD
0.0
GBP / JPY
0.1
GBP / CHF
0.3
USD / JPY
0.0
USD / CHF
0.2
CHF / JPY
0.3
Dodatočný poplatok
Priebežná sadzba
Premenné
premena
Pips premenných
Regulácia
Áno
FCA
No
CYSEC
No
ASIC
No
CFTC
No
NFA
No
BAFIN
No
CMA
No
SCB
No
DFSA
No
CBFSAI
No
BVIFSC
No
Fsca
No
FSA
No
FFAJ
No
ADGM
No
FRSA
Pri obchodovaní CFD s týmto poskytovateľom stráca 71% z účtu retailových investorov peniaze.
hodnotenie
Celkové náklady
$ 0
![]() Provízie
0
Provízie
0
Min.záloha
$100
Roztierajte min.
- jadierka
Pákový efekt max
400
menových párov
50
Obchodné platformy
Metódy financovania
Regulované podľa
CYSECASICCBFSAIBVIFSCFscaFSAFFAJADGMFRSA
Čo môžete obchodovať
forex
Indexy
Akcia
Cryptocurrencies
suroviny
Etfs
Priemerné rozpätie
EUR / GBP
1
EUR / USD
0.9
EUR / JPY
1
EUR / CHF
1
GBP / USD
1
GBP / JPY
1
GBP / CHF
1
USD / JPY
1
USD / CHF
1
CHF / JPY
1
Dodatočný poplatok
Priebežná sadzba
-
premena
- jadierka
Regulácia
No
FCA
Áno
CYSEC
Áno
ASIC
No
CFTC
No
NFA
No
BAFIN
No
CMA
No
SCB
No
DFSA
Áno
CBFSAI
Áno
BVIFSC
Áno
Fsca
Áno
FSA
Áno
FFAJ
Áno
ADGM
Áno
FRSA
Pri obchodovaní CFD s týmto poskytovateľom stráca 71% z účtu retailových investorov peniaze.

hodnotenie
Celkové náklady
$ 0
![]() Provízie
6.00
Provízie
6.00
Min.záloha
$10
Roztierajte min.
- jadierka
Pákový efekt max
10
menových párov
60
Obchodné platformy
Metódy financovania
Čo môžete obchodovať
forex
Indexy
Cryptocurrencies
Priemerné rozpätie
EUR / GBP
1
EUR / USD
1
EUR / JPY
1
EUR / CHF
1
GBP / USD
1
GBP / JPY
1
GBP / CHF
1
USD / JPY
1
USD / CHF
1
CHF / JPY
1
Dodatočný poplatok
Priebežná sadzba
-
premena
- jadierka
Regulácia
No
FCA
No
CYSEC
No
ASIC
No
CFTC
No
NFA
No
BAFIN
No
CMA
No
SCB
No
DFSA
No
CBFSAI
No
BVIFSC
No
Fsca
No
FSA
No
FFAJ
No
ADGM
No
FRSA
Váš kapitál je ohrozený.
hodnotenie
Celkové náklady
$ 0
![]() Provízie
0.1
Provízie
0.1
Min.záloha
$50
Roztierajte min.
- jadierka
Pákový efekt max
500
menových párov
40
Obchodné platformy
Metódy financovania
Čo môžete obchodovať
forex
Indexy
Akcia
suroviny
Priemerné rozpätie
EUR / GBP
-
EUR / USD
-
EUR / JPY
-
EUR / CHF
-
GBP / USD
-
GBP / JPY
-
GBP / CHF
-
USD / JPY
-
USD / CHF
-
CHF / JPY
-
Dodatočný poplatok
Priebežná sadzba
-
premena
- jadierka
Regulácia
No
FCA
No
CYSEC
No
ASIC
No
CFTC
No
NFA
No
BAFIN
No
CMA
No
SCB
No
DFSA
No
CBFSAI
No
BVIFSC
No
Fsca
No
FSA
No
FFAJ
No
ADGM
No
FRSA
Pri obchodovaní CFD s týmto poskytovateľom stráca 71% z účtu retailových investorov peniaze.
The importance of horizontal levels
Most traders consider horizontal levels to be just as important as price action, which is the core to Forex trading. Analyzing the combination of the price change and the horizontal levels can allow us to understand the trend and predict where the market will go next. Although horizontal levels is a very basic Forex trading strategy, many famous and experienced traders such as Jesse Livermore, Warren Buffett, and George Soros have confirmed that they use it as a basis to many of their strategies.
To learn more about How to read and trade the price action – Forex Trading Strategies
Horizontal levels help us spot key areas on a chart where a change in trend is likely to occur. This can help us when deciding where to place a stop, or when we want to enter a trade but don’t know the right time to do so. Precise timing can be crucial in many Forex trading strategies and a careful analysis of the horizontal levels can help us find the correct timing and place a good trade. Keep in mind that horizontal levels may be the foundation for many strategies but on its own, it is usually not enough and must be used in combination with other forex trading strategies.
Horizontal Levels and ‘Swing Points’
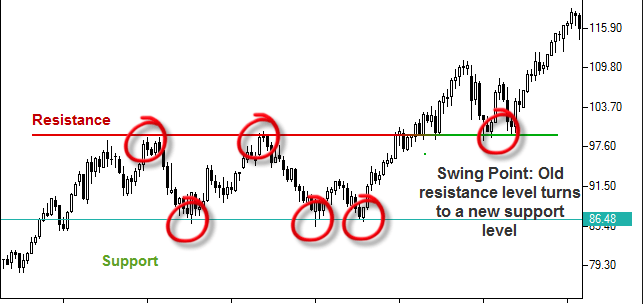
The best way to use horizontal levels to our advantage is by analyzing the swing points. Swing points are points where the trend changes, and by marking horizontal levels at these points we can find prices where there is likely to be a change in trend. The illustration below clearly shows how we can use horizontal levels to our advantage.
Notice how the swing points have the tendency to repeat themselves. Support levels can turn into resistance levels and vice versa. By marking the horizontal levels on the chart we can predict when the next swing point will occur and enter/exit a trade at the perfect time. The blue circles on the chart are the points that we should have been able to notice in advanced. These are the most obvious entry points, and by noticing them we would have given an edge to any strategy that we chose to use.
Horizontal Levels and Ranging Markets
Horizontal levels are also very useful in range-bound markets. Range-bound markets are markets where the price has very clear upper and lower boundaries that the price doesn’t cross. By watching the price as it approaches one of the boundaries we can predict with great accuracy where the price will trend next. As always, the price can be unpredictable and might break the boundary just as we decide to enter a trade, but overall this strategy is very reliable and safe. The illustration below shows an example of a range-bound market.
Notice how the price jumps back and forth between two very obvious boundaries. By marking these boundaries as our horizontal levels we can use them to our advantage. Wait for the price to approach one of the boundaries to make a move. As we know that the price is not likely to cross the horizontal level at the boundary, we can enter a trade, expecting the trend to switch, and the price to go back away from the horizontal level.
If the price was approaching the upper boundary, expect the trend to be bearish and the price to go down and if the price was approaching the lower boundary expect a bullish trend and an up-going price change. Risk and reward levels are also very easy to choose in this kind of market. The risk level should be just above or below the boundary that you entered the trade from and the reward level should be at the opposite boundary of the range-bound market.
It is important to remember that these are only three Forex trading strategies which are based on technical analysis of the charts. There are dozens of unique strategies out there. Some are long term and some are short term. Some forex trading strategies involve great risk while others are almost risk-free. Some strategies are based on a deep understanding of current economic events while others are based on a technical analysis of the market and trends. The list is endless and diverse.