Serviciu de copy-trading. Algo nostru deschide și închide automat tranzacțiile.
L2T Algo oferă semnale extrem de profitabile cu risc minim.
Tranzacționare 24/7 cu criptomonede. În timp ce dormi, facem schimb.
Configurare de 10 minute cu avantaje substanțiale. Manualul este furnizat odată cu achiziția.
Rata de succes de 79%. Rezultatele noastre vă vor entuziasma.
Până la 70 de tranzacții pe lună. Sunt mai mult de 5 perechi disponibile.
Abonamentele lunare încep de la 58 GBP.
The multiple time frames trading strategy is a Forex trading strategy that works by following a single currency pair over different time frames. By following the price chart we can see the highs and lows and establish the overall and temporary trend. However, by looking at the different time frames we can see changes and patterns that we were not able to spot by using a single time frame.
4
Modalitati de plata
Platforme de tranzacționare
Reglementat de
Suport
Depozit min
Levier max
Perechi valutare
Clasificare
Mobile App
Evaluare
Cost total
$ 0
![]() Comision
3.5
Comision
3.5
Depozit min
$100
Spread min.
Sâmburi de variabile
Levier max
100
Perechi valutare
40
Platforme de tranzacționare
Metode de finanțare


Reglementat de
FCA
Ce poți face schimb
Forex
Indici
Acţiuni
Cryptocurrencies
materii prime
Spread mediu
EUR / GBP
-
EUR / USD
-
EUR / JPY
0.3
EUR / CHF
0.2
GBP / USD
0.0
GBP / JPY
0.1
GBP / CHF
0.3
USD / JPY
0.0
USD / CHF
0.2
CHF / JPY
0.3
Taxa aditionala
Rată continuă
Variabile
transformare
Sâmburi de variabile
Regulament
Da
FCA
Nu
CYSEC
Nu
ASIC
Nu
CFTC
Nu
RNP
Nu
BAFIN
Nu
CMA
Nu
SCB
Nu
DFSA
Nu
CBFSAI
Nu
BVIFSC
Nu
FSCA
Nu
FSA
Nu
FFAJ
Nu
ADGM
Nu
FRSA
71% din conturile investitorilor de retail pierde bani atunci când tranzacționează CFD-uri cu acest furnizor.
Evaluare
Cost total
$ 0
![]() Comision
0
Comision
0
Depozit min
$100
Spread min.
- sâmburi
Levier max
400
Perechi valutare
50
Platforme de tranzacționare
Metode de finanțare
Reglementat de
CYSECASICCBFSAIBVIFSCFSCAFSAFFAJADGMFRSA
Ce poți face schimb
Forex
Indici
Acţiuni
Cryptocurrencies
materii prime
Etfs
Spread mediu
EUR / GBP
1
EUR / USD
0.9
EUR / JPY
1
EUR / CHF
1
GBP / USD
1
GBP / JPY
1
GBP / CHF
1
USD / JPY
1
USD / CHF
1
CHF / JPY
1
Taxa aditionala
Rată continuă
-
transformare
- sâmburi
Regulament
Nu
FCA
Da
CYSEC
Da
ASIC
Nu
CFTC
Nu
RNP
Nu
BAFIN
Nu
CMA
Nu
SCB
Nu
DFSA
Da
CBFSAI
Da
BVIFSC
Da
FSCA
Da
FSA
Da
FFAJ
Da
ADGM
Da
FRSA
71% din conturile investitorilor de retail pierde bani atunci când tranzacționează CFD-uri cu acest furnizor.

Evaluare
Cost total
$ 0
![]() Comision
6.00
Comision
6.00
Depozit min
$10
Spread min.
- sâmburi
Levier max
10
Perechi valutare
60
Platforme de tranzacționare
Metode de finanțare
Ce poți face schimb
Forex
Indici
Cryptocurrencies
Spread mediu
EUR / GBP
1
EUR / USD
1
EUR / JPY
1
EUR / CHF
1
GBP / USD
1
GBP / JPY
1
GBP / CHF
1
USD / JPY
1
USD / CHF
1
CHF / JPY
1
Taxa aditionala
Rată continuă
-
transformare
- sâmburi
Regulament
Nu
FCA
Nu
CYSEC
Nu
ASIC
Nu
CFTC
Nu
RNP
Nu
BAFIN
Nu
CMA
Nu
SCB
Nu
DFSA
Nu
CBFSAI
Nu
BVIFSC
Nu
FSCA
Nu
FSA
Nu
FFAJ
Nu
ADGM
Nu
FRSA
Capitalul dvs. este în pericol.
Evaluare
Cost total
$ 0
![]() Comision
0.1
Comision
0.1
Depozit min
$50
Spread min.
- sâmburi
Levier max
500
Perechi valutare
40
Platforme de tranzacționare
Metode de finanțare
Ce poți face schimb
Forex
Indici
Acţiuni
materii prime
Spread mediu
EUR / GBP
-
EUR / USD
-
EUR / JPY
-
EUR / CHF
-
GBP / USD
-
GBP / JPY
-
GBP / CHF
-
USD / JPY
-
USD / CHF
-
CHF / JPY
-
Taxa aditionala
Rată continuă
-
transformare
- sâmburi
Regulament
Nu
FCA
Nu
CYSEC
Nu
ASIC
Nu
CFTC
Nu
RNP
Nu
BAFIN
Nu
CMA
Nu
SCB
Nu
DFSA
Nu
CBFSAI
Nu
BVIFSC
Nu
FSCA
Nu
FSA
Nu
FFAJ
Nu
ADGM
Nu
FRSA
71% din conturile investitorilor de retail pierde bani atunci când tranzacționează CFD-uri cu acest furnizor.
Find out more about Trend Trading – Forex Trading Strategies
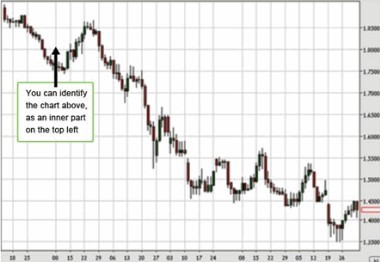
In the chart above every candlestick represents 2 hours. The chart consists of 360 candlesticks that altogether constitute 1 full month.
Learn more about Candlestick – Forex Trading Strategies
On the left side of the chart, marked with purple markings, are mini-trends. If we would have looked at a shorter time frame we would have seen these mini-trends but would not have seen the bigger picture which shows a much larger bullish trend.
Now let’s look at an even larger time frame and see how it affects our understanding of the trend.
This is a chart of a half-year time frame. Each candlestick on this chart represents 1 day. As you can see, what we analyzed as a bullish trend appears in this time frame to be just a small pullback of an overall bearish trend.
Clearly, when looking at a single time frame you can’t know the whole story. As a rule, it is critical to know the whole story before making an investment. Examining the price change over numerous time frames can act as an indicator in telling us when to enter or exit a trade.
Standard time frames to focus on are time frames in which each candlestick represents 15 minutes, 30 minutes or 1 hour. These time frames fall right in the middle as they allow the trader enough time to examine the market before making a move but are not too long-term, making them profitable over relatively short periods of time.
To sum up, each time frame has its benefits. Long time frames allow us to understand the bigger picture and identify the overall trend. Average time frames present the short term trend and show us what is happening in the market right now. Short time frames are our way of recognizing the exact window for when to make our move.
To successfully execute multiple time frame analysis, the suggested working process is to choose a time frame to work in and then verify your move with a longer time frame. Working with three different time frames is possible. However, be careful when working with three or more time frames as it can cause a great deal of confusion and chart mix-ups.