
Service for copy trading. Our Algo automatically opens and closes trades.
The L2T Algo provides highly profitable signals with minimal risk.
24/7 cryptocurrency trading. While you sleep, we trade.
10 minute setup with substantial advantages. The manual is provided with the purchase.
79% Success rate. Our outcomes will excite you.
Up to 70 trades per month. There are more than 5 pairs available.
Monthly subscriptions begin at £58.
Bitcoin (BTC) Price Analysis – October 9
For the past 15 days now, Bitcoin has been undergoing a consolidation phase after bouncing off at $77000 area in late September. With -0.29% loss over the past hours, the BTC price now fluctuates at around the $8200 zones. As the market waits for the next shock-wave, Bitcoin’s price may roll to $6400 – the April 2 surge level if a bearish surge resurfaces.
Bitcoin (BTC) Price Analysis: Daily Chart – Bearish
Key resistance levels: $8370, $8533, $8770. $8997
Key support levels: $7733, $7300, $7000, $6400
Following the September 30 sharp bounce at $7700, Bitcoin is currently fragile – subduing with choppy price action on the daily time frame. Again, the market is sensing a big move lurking around the corner. Breaking the key support zones at $7733 – $7300, BTC may plummet to $7000 and $6400 to meet the 4-months channel’s support.
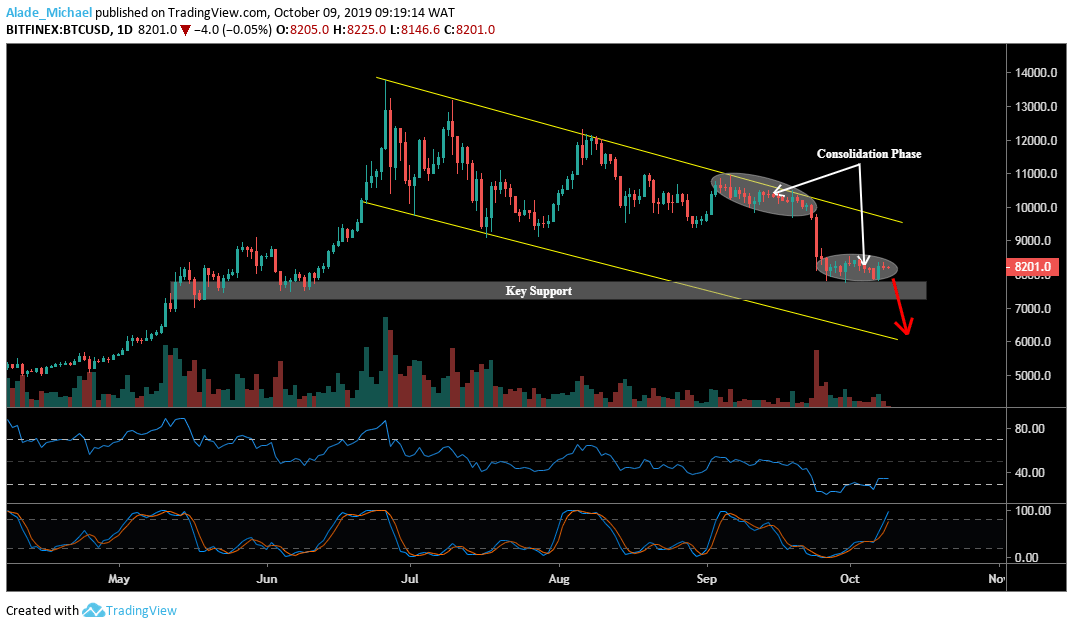
Currently, the price is still consolidating above the $8000 price zones. Should the bulls act upon these mentioned zones, Bitcoin may further correct to $8370, $8533, $8770 and $8997 resistance before we can continuing bearish rally. To top that, the crypto trading signals a strong bearish trend on the RSI but the market has managed to rise up on the Stochastic RSI since the beginning of the month.
Bitcoin (BTC) Price Analysis: 4H Chart – Neutral
Bitcoin has been shaping in a triangle pattern on the 4-hour chart and has remained indecisive for the past two weeks. The crypto trading signals that a potential surge in volatility may play out sooner or later. This pattern is a bearish formation with close supports at $7750 – a breakout area. A clear drive beneath the triangle might send the price to $7500, $7300 and $7000 support.
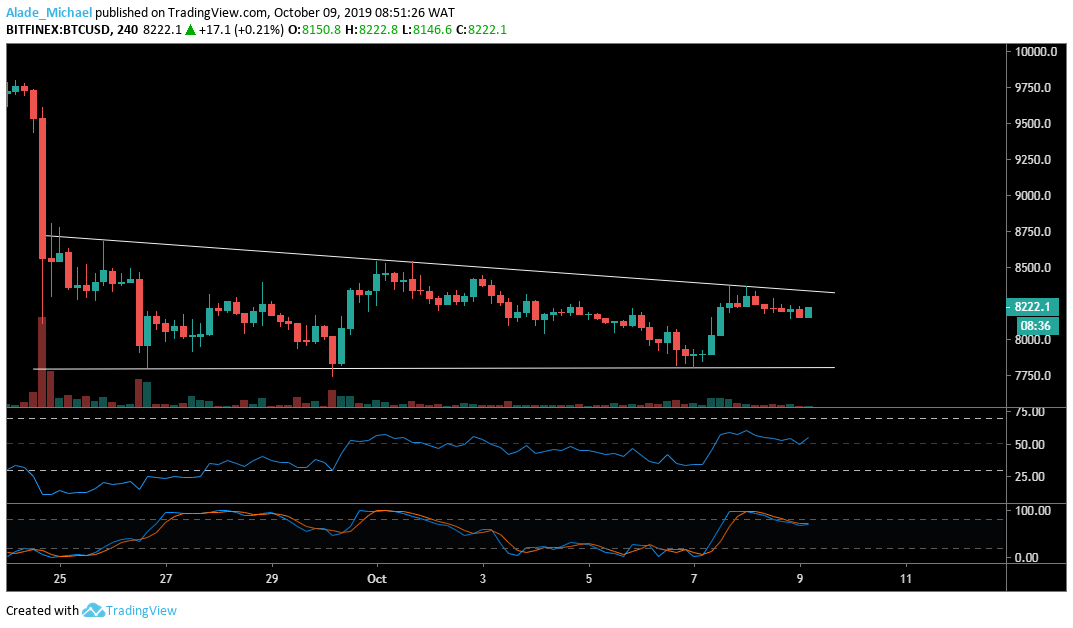
But as it appeared now, Bitcoin is bullish on the RSI indicator, making its price to trade at around the triangle’s upper boundary. The price could float above $8000 if the RSI 50 can hold. Nevertheless, the $8400, $8533 and $8700 resistance could play out if a bullish surge occurs. Inversely, the crypto trading signals a bearish move on the Stochastic RSI to show that the sellers may step back in the market.
BITCOIN SELL SIGNAL
Sell Entry: $8197
TP: $7750
SL: $8350
- Broker
- Min Deposit
- Score
- Visit Broker

- Award-winning Cryptocurrency trading platform
- $100 minimum deposit,
- FCA & Cysec regulated

- 20% welcome bonus of upto $10,000
- Minimum deposit $100
- Verify your account before the bonus is credited

- Over 100 different financial products
- Invest from as little as $10
- Same-day withdrawal is possible
- Fund Moneta Markets account with a minimum of $250
- Opt in using the form to claim your 50% deposit bonus