
Servizz ta' kummerċ ta' kopji. L-Algo tagħna awtomatikament jiftaħ u jagħlaq il-kummerċ.
L-L2T Algo jipprovdi sinjali ta 'profitt ħafna b'riskju minimu.
Kummerċ tal-kripto-munita 24/7. Waqt li torqod, aħna nnegozjaw.
Setup ta '10 minuti b'vantaġġi sostanzjali. Il-manwal huwa pprovdut max-xiri.
79% Rata ta' suċċess. Ir-riżultati tagħna se jħeġġuk.
Sa 70 kummerċ fix-xahar. Hemm aktar minn 5 pari disponibbli.
L-abbonamenti ta’ kull xahar jibdew minn £58.
S&P 500 market may experience increased bearish pressure
Analiżi tal-Prezzi S&P 500 - 03 ta' Jannar
S&P 500 jista' jikser the $3740 support level if selling pressure increases, and more selling pressure could push the price as low as $3649 and $3493 levels. If the support level of $3740 holds, the price may turn around and climb toward the resistance levels of $3926, $4087, and $4169.
Livelli ewlenin:
Livelli ta 'reżistenza: $ 3926, $ 4087, $ 4169
Livelli ta 'appoġġ: $ 3740, $ 3649, $ 3493
S&P 500 Xejra fit-tul: Bearish
S&P 500 is in a bearish trend on the daily chart. The bulls lost steam after the price passed the $4087 barrier threshold. A tiny double-top chart pattern formed at the aforementioned level, indicating that sellers are ready to seize control of the market. As the sellers’ pressure increased, the price broke through the $3926 support level. At this time, $3740 is the desired support level.
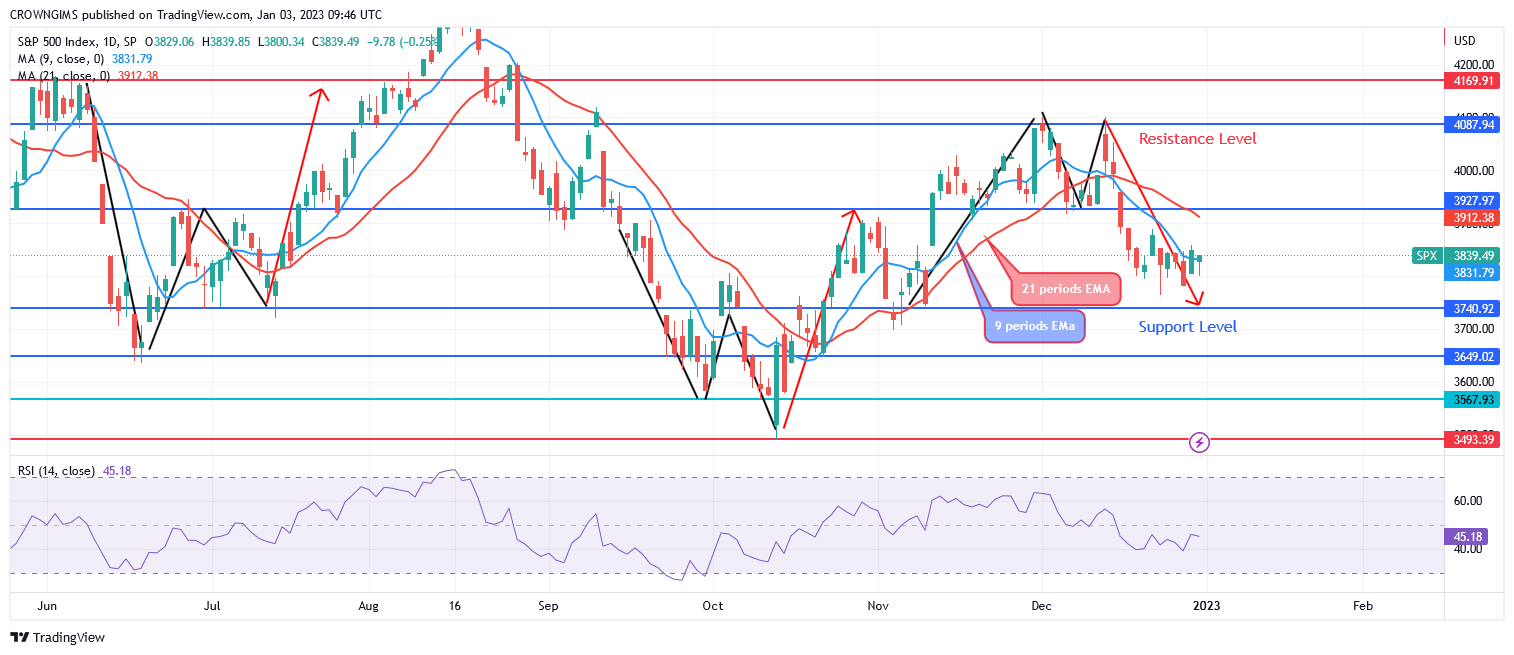
Bearish momentum is present because the S&P 500 is trading below both the 9- and 21-period exponential moving averages. The S&P 500 may violate the $3740 support level if selling pressure increases, and more selling pressure could push the price as low as $3649 and $3493 levels. If the support level of $3740 holds, the price may turn around and climb toward the resistance levels of $3926, $4087, and $4169. A sell signal is being displayed because the Relative Strength Index period 14 is at 45 and the signal line is moving lower.
S&P 500 Xejra fuq terminu medju: Bearish
The 4-hour chart’s forecast indicates that the S&P 500 is headed downward. The price fluctuation in the 4-hour window resulted in an “M” chart pattern. The price surpassed the $4087 barrier mark. It has breached the former support level of $3926, which it had previously tested. The price direction is determined by the bearish chart pattern that was generated.
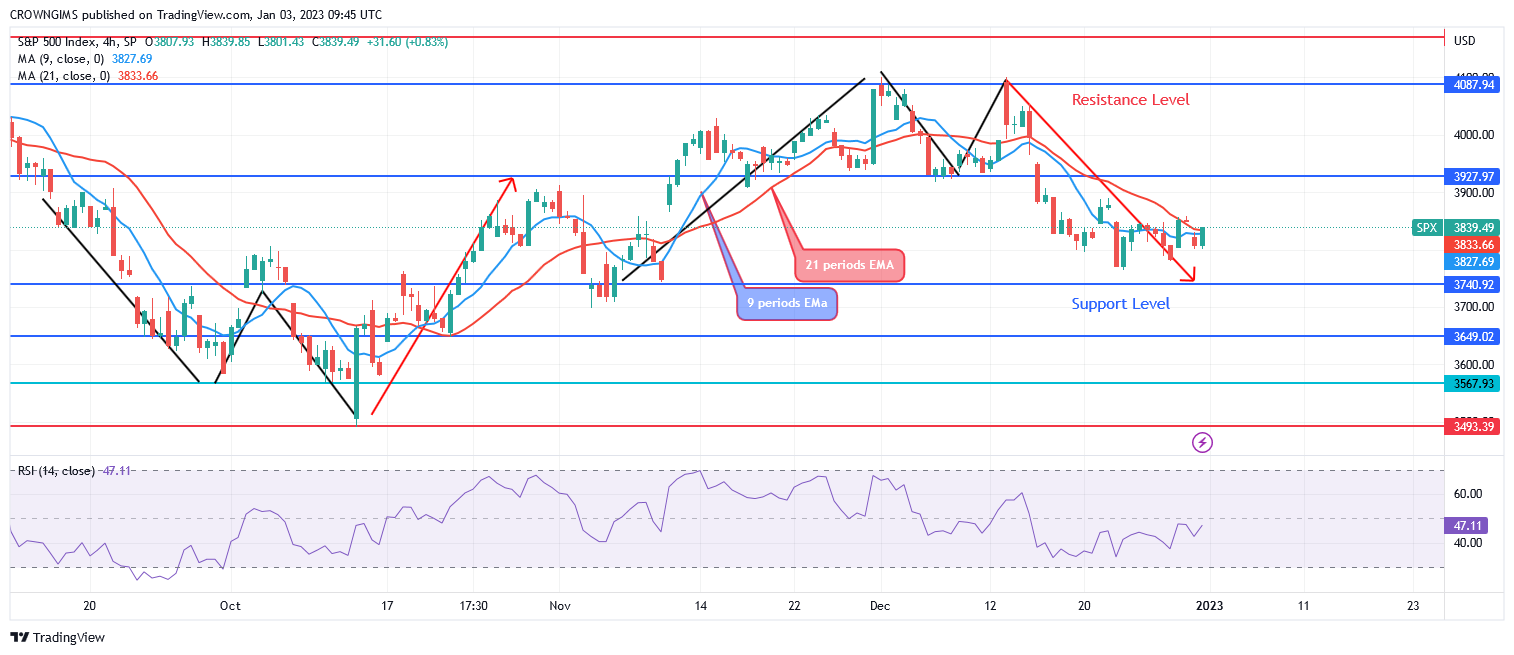
Because it is trading below both the 9- and 21-period exponential moving averages, the price is heading downward. The Relative Strength Index period 14 at 47 levels displays a bullish signal.
Tista 'tixtri Lucky Block hawn. Ixtri LBLOCK
- Broker
- Depożitu Min
- Punteġġ
- Żur is-sensar

- Pjattaforma tal-kummerċ Cryptocurrency rebbieħa
- Depożitu minimu ta '$ 100,
- FCA & Cysec regolati

- 20% bonus ta 'merħba sa $ 10,000
- Depożitu minimu $ 100
- Ivverifika l-kont tiegħek qabel ma jiġi kkreditat il-bonus

- Iktar minn 100 prodott finanzjarju differenti
- Investi minn $ 10
- Irtirar fl-istess jum huwa possibbli
- Kont tal-Fond Moneta Markets b’minimu ta ’$ 250
- Agħżel billi tuża l-formola biex titlob il-bonus tad-depożitu ta '50% tiegħek