More Technical Trading Indicators
Having met Mr. Fibonacci, it’s time to get to know some other popular technical indicators. The indicators you are about to learn about are formulas and mathematical tools. As prices shift all the time, the indicators help us put prices into patterns and systems.
Technical indicators are on the trading platforms for us, operating on the charts themselves, or beneath them.
More Technical Indicators
-
- Moving Averages
- RSI
- Bollinger Bands
- MACD
- Stochastic
- ADX
- SAR
- Pivot Points
- Summary
Important: Although there are a wide variety of technical indicators, you don’t have to use them all! In fact, the contrary is true! Traders should not use too many tools. They will just become confusing. Working with more than 3 tools will slow you down and cause mistakes. As in every other area in life, there is a point on the advancement graph that once breached, efficiency starts to drop. The idea is to choose 2 to 3 powerful, effective tools and to feel comfortable working with them (and more importantly, ones that help you achieve good results).
Tip: We do not recommend using more than two indicators simultaneously, especially not during your first couple of months. You should master the indicators one at the time and then combine two or three of them.
The indicators which we are going to present to you are our favorites and in our own opinion, the most successful ones. Be consistent with which tool you work with. Think of them as an index of formulas for a mathematics exam – you can study them perfectly in theory, but unless you run a few exercises and sample tests you will not truly have control and know how to use them!
Back to business:
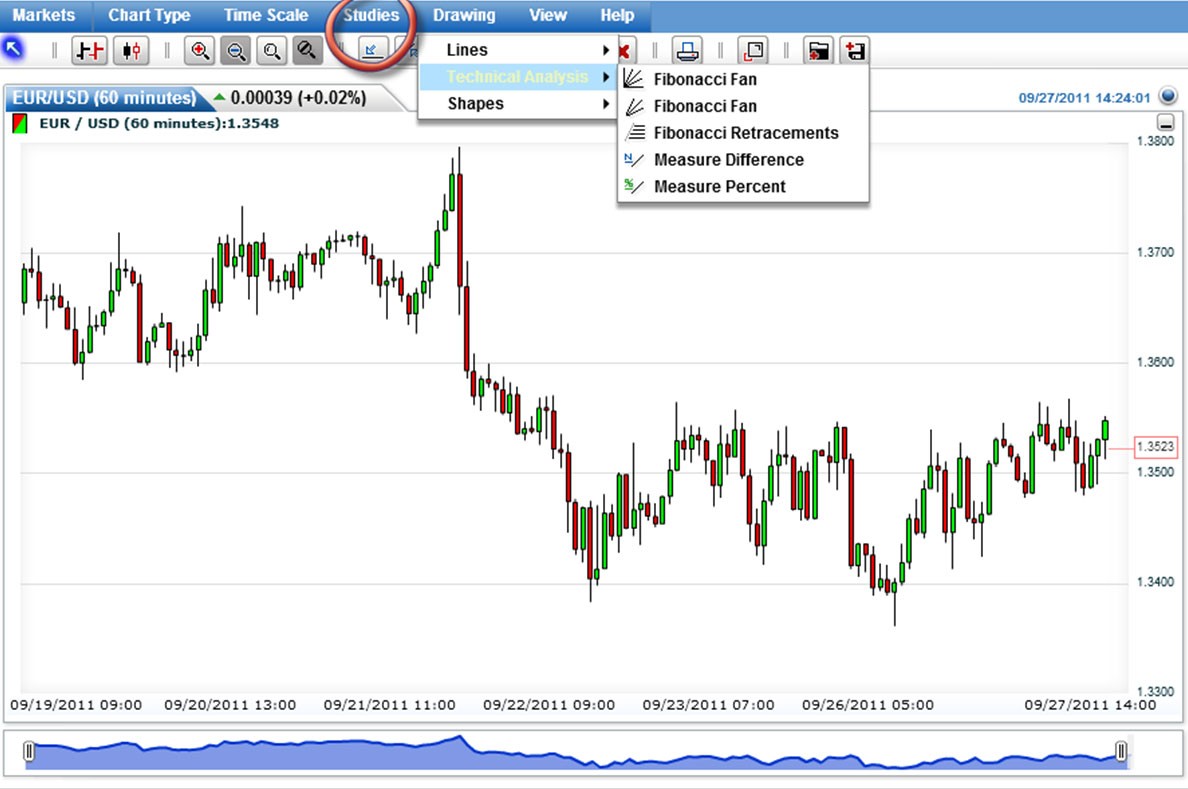
We mentioned that indicators are formulas. These formulas are based on past and present prices in order to try to foresee the expected price. The Indicators box is situated in the chart Tools Tab (or Indicators Tab), on the trading platforms.
Let’s see how it looks like on eToro’s WebTrader platform:
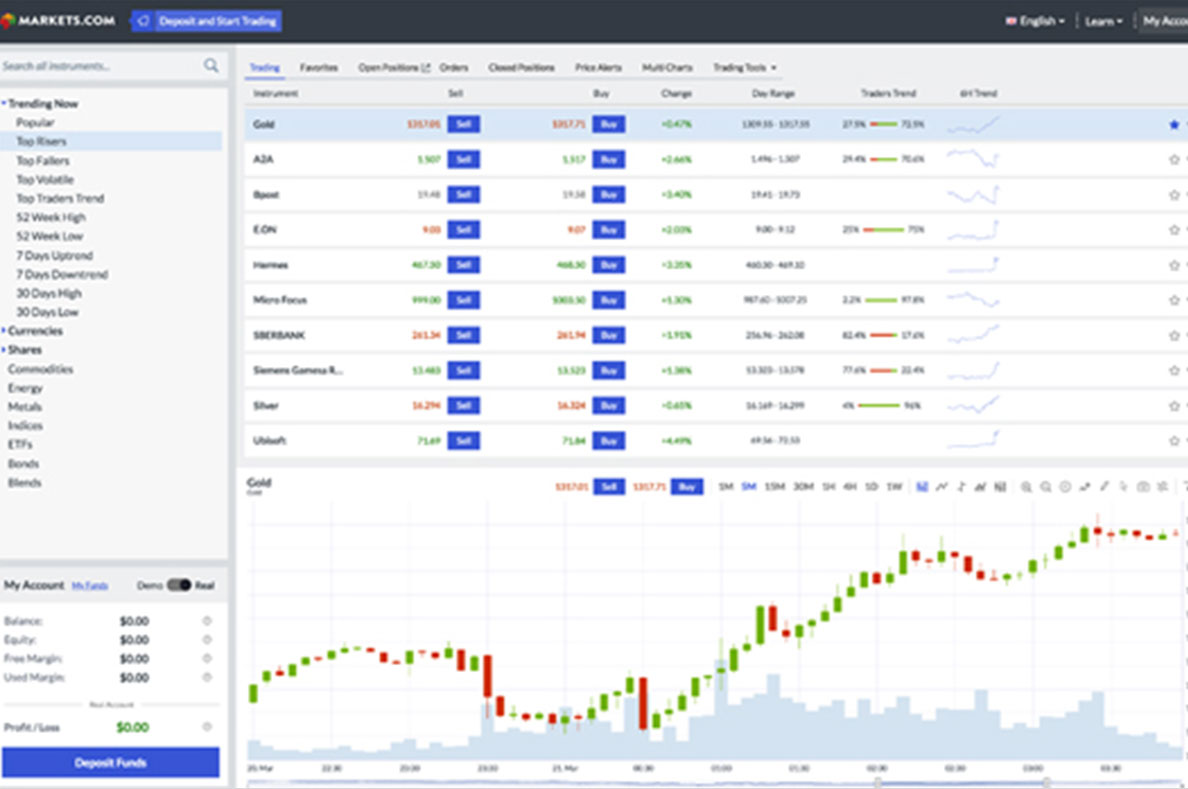
See how it looks the Markets.com trading platform:
AVA Trader web platform:

Now, time to meet our indicators:
Moving Averages
Prices shift many times during each session. A standard trend can be unexpected, volatile and full of changes. Moving averages are intended to put order into prices. A
moving average is the average of pair’s closing prices over a period of timeframes (a single bar or candle can represent different timeframes, for example- 5 minutes, 1 hour, 4 hours, and so on. But you already know that…). Traders can choose the timeframe and the number of candlesticks they want to examine using this tool.
Averages are fantastic for getting a sense of the general direction of market price, analyzing a pair’s behavior and predicting future trends, especially when using another indicator at the same time.
The smoother an average price (without significant ups and downs), the slower its reaction to market changes will be.
There are two main types of moving averages:
- Simple Moving Average (SMA): By connecting all closing points you get the SMA. This calculates the average price of all closing points within a chosen timeframe. Due to its nature, it indicates a near future trend by reacting a little late (because it is an average, and that is how an average behaves).
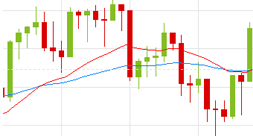
The problem is that radical, one-time events that took place within the tested timeframe have a major impact on SMA (in general, radical numbers have a larger impact on an average than moderate numbers), which might give the wrong impression of an incorrect trend. Example: Three SMA lines are presented in the chart below. Each candle represents 60 minutes. The blue SMA is an average of 5 consecutive closing prices (go 5 bars back and calculate their closing price averages). The pink SMA is an average of 30 consecutive prices, and the yellow is an average of 60 consecutive closing prices. You will notice a very logical tendency in the chart: as the number of candlesticks increases, the SMA becomes smoother, while it responds more slowly to market changes (more distant from the real-time price. When an SMA line cuts a Price line, we can predict with relatively high probability a coming change in the trend’s direction. When the price cuts the average from below upwards, we are getting a buying signal, and vice versa.
 - An example of moving average of a forex chart:Let’s take a look at another example:Pay attention to the cutting points of the price line and SMA line, and especially to what happens to the trend right afterwards. Tip: The best way to use this SMA is to combine two or three SMA lines. By following their cutting points you can determine expected future trends. It increases our confidence in shifting the trend direction – as all the moving averages are broken, like in the following chart:
- Exponential Moving Averages (EMA): Similar to SMA, except for one thing – The Exponential Moving Average gives greater weight to the last timeframes, or in other words, to the closest candlesticks to the current time. If you look at the next chart, you will be able to notice the gaps created between the EMA, SMA and the price:
- Remember: While EMA is more effective in the short term (responds quickly to the price’s behavior and helps to spot a trend early on), SMA is more effective in the longer term. It is less sensitive. On the one hand it is more solid, and on the other hand it responds more slowly.In conclusion:
SMA EMA PROS Disregards most Fakeouts by displaying smooth charts Quickly responds to the market. More alert to price shifts CONS Slow reactions. May cause late selling and buying signals More exposed to Fakeouts. Can cause misleading signals If the price line stays above the moving average line – the trend is an uptrend, and vice versa.
Important: Pay attention! This method does not work every single time! When the trend reverses, you are advised to wait for 2-3 candlesticks (or bars) to appear after the current cutting point, in order to be sure that reversal has been completed! It is always recommended to set a Stop Loss strategy (which you are about to study in the next lesson) to prevent unwelcome surprises.
Example: Notice the excellent usage of EMA as a resistance level in the next chart (SMA can also be used as a support/resistance level, but we prefer using EMA):
Now, let’s examine the usage of two EMA lines (two timeframes) as support levels:
When candles hit the inner zone between the two lines and turn back – that’s where we will execute a Buy/Sell order! In that case – Buy.
One more example: The red line is a 20′ SMA. The blue line is a 50′ SMA. Pay attention to what happens each time there is an intersection – the price moves in the same direction as the red line (shorter term!):
Important: Averages can be breached, exactly like support and resistance levels:
To sum up, SMA and EMA are fantastic indicators. We strongly recommend you practice them well and use them when actually trading.
 When an SMA line cuts a Price line, we can predict with relatively high probability a coming change in the trend’s direction. When the price cuts the average from below upwards, we are getting a buying signal, and vice versa.
 Let’s take a look at another example:Pay attention to the cutting points of the price line and SMA line, and especially to what happens to the trend right afterwards.
 Tip: The best way to use this SMA is to combine two or three SMA lines. By following their cutting points you can determine expected future trends. It increases our confidence in shifting the trend direction – as all the moving averages are broken, like in the following chart:
 Remember: While EMA is more effective in the short term (responds quickly to the price’s behavior and helps to spot a trend early on), SMA is more effective in the longer term. It is less sensitive. On the one hand it is more solid, and on the other hand it responds more slowly.In conclusion:


RSI (Relative Strength Index)
One of the few Oscillators that you will learn about. RSI operates as an elevator that moves up and down on the market’s momentum scale, checking a pair’s strength. It belongs to the group of indicators that are presented beneath the chart, in a separate section. RSI is very popular among technical traders. The scale on which RSI moves is 0 to 100.
Strong milestones are 30′ for oversold conditions (price below 30′ sets an excellent Buy signal), and 70′ for overbought conditions (price above 70′ sets an excellent Sell signal). Other good points (although riskier, for more aggressive traders) are 15′ and 85′. Conservative traders prefer to work with point 50′ for identifying trends. Crossing 50′ indicates that the reversal has been completed.

Let’s see how it looks on the trading platform:

On the left-hand side, higher than 70′ the RSI signals a coming downtrend; crossing the 50′ level confirms the downtrend, and going below 30′ indicates on an oversold condition. Time to think of exiting your SELL position.
Pay attention on the next chart to breached points 15 and 85 (circled), and to the following change in direction:

Stochastic Indicator
This is another Oscillator. The Stochastic informs us of a potential end of trend. It helps us avoid Oversold and Overbought market conditions. It works well in all timeframe charts, particularly if you combine it with other indicators such as trend lines, candlestick formations, and moving averages.
Stochastic also operates on a 0 to 100 scale. The red line is set on point 80′ and the blue line on point 20′. When the price declines beneath 20′, the market condition is Oversold (selling forces are out of proportion, namely there are too many sellers) – time to set a Buy order! When the price is over 80′ – the market condition is overbought. Time to set a Sell order!
For instance take a look at the USD/CAD, 1 hour chart:

Stochastic works the same way as RSI. It is clear on the chart how it signals upcoming trends
Bollinger BandsBollinger Bands
A slightly more advanced tool, based on averages. Bollinger Bands are made of 3 lines: the upper and lower lines create a channel that is cut in the middle by a central line (some platforms do not present the central Bollinger line).
Bollinger Bands measure the market’s instability. When the market is proceeding peacefully, the channel shrinks, and when the market gets frantic, the channel expands. Price constantly tends to revert to the center. Traders can set bands’ length according to the timeframes they want to watch.
Let’s look at the chart and learn more about Bollinger bands:

Tip: Bollinger Bands operate as supports and resistances. They work fantastically when the market is unstable and it is hard for traders to identify a clear trend.

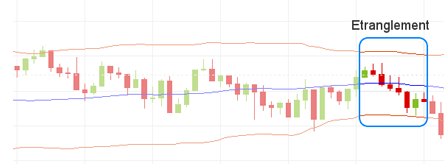
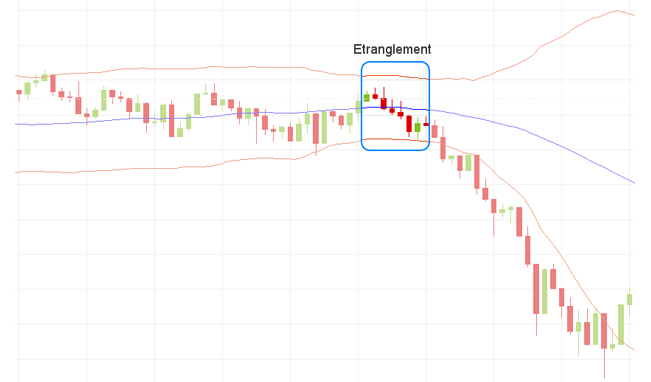
Bollinger squeezing – Great strategic way to examine the Bollinger Bands. This alerts us to a massive trend on its way while it gets locked on early breakouts. If sticks are starting to poke out on the top band, beyond the shrinking channel, we can guess that we have a general future, upward direction, and vice versa!
Check out this marked red stick that is poking out (GBP/USD, 30 minutes chart):

In most cases, a shrinking gap between the bands informs us that a serious trend is on the go!
If the price is located below the centerline, we will probably witness an uptrend, and vice versa.
Let’s see an example:

Tip: It is advised to use Bollinger Bands on short timeframes like a 15 minute candlesticks chart.
ADX (Average Directional Index)
The ADX tests a trend’s strength. It also operates on a 0 to 100 scale. It is shown below the charts.
Important: ADX examines trend’s strength rather than its direction. In other words, it checks whether market is ranging or going on a new, clear trend.
A strong trend would put us above 50′ on the ADX. A weak trend would put us below 20′ on the scale. In order to understand this tool, take a look on the following example.
Example of the EUR/USD using ADX trading strategy:
You will notice that while ADX is above 50′ (highlighted green area) a strong trend exists (in this case – a downtrend). When ADX drops below 50′ – the downfall stops. It might be a good time to exit the trade. Whenever ADX is below 20′ (highlighted red area) you can see from the chart that there is no clear trend.
Tip: If the trend goes below 50′ again, it might be time for us to exit trading and rearrange our position. ADX is effective when deciding if to exit at an early stage. It is mainly helpful when integrated with other indicators that point to a trends’ directions.
MACD (Moving Average Convergence Divergence)
MACD is shown beneath the charts, in a separate section. It is built of two moving averages (short-term and long-term) plus a histogram that measures their gaps.
In simple terms – It is actually an average of two different timeframes’ averages. It is not the prices’ average!
Tip: The most important area in the MACD is the intersection of the two lines. This method is very good at spotting reversals of trends in good time.
Disadvantage – You need to remember that you are watching averages of past averages. That is why they lag behind real-time price changes. Still, it is quite an effective tool.
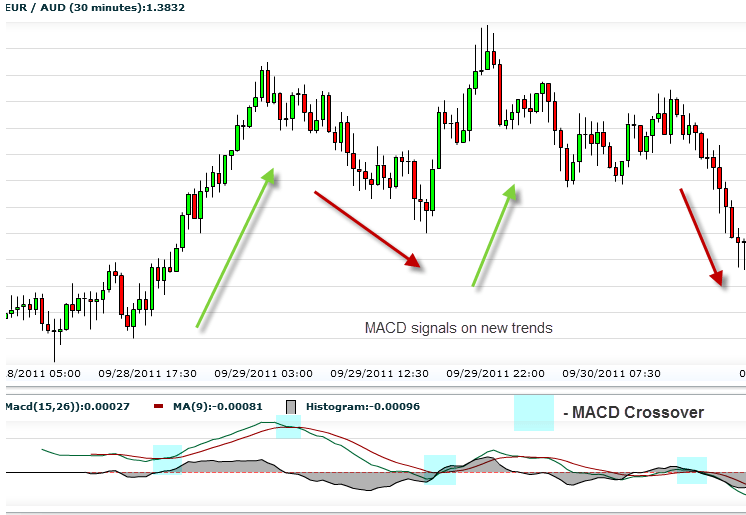
Example: Pay attention to the intersections of the long average (green line) and the short (red). See on the price chart how well they alert to a changing trend.
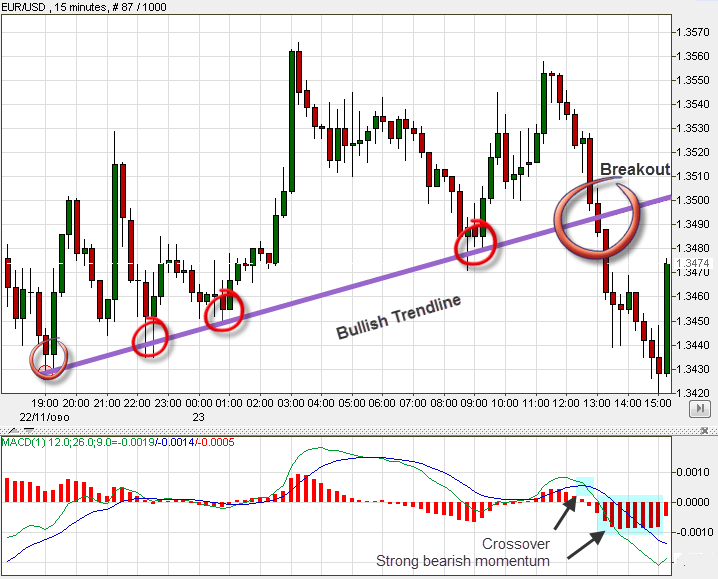
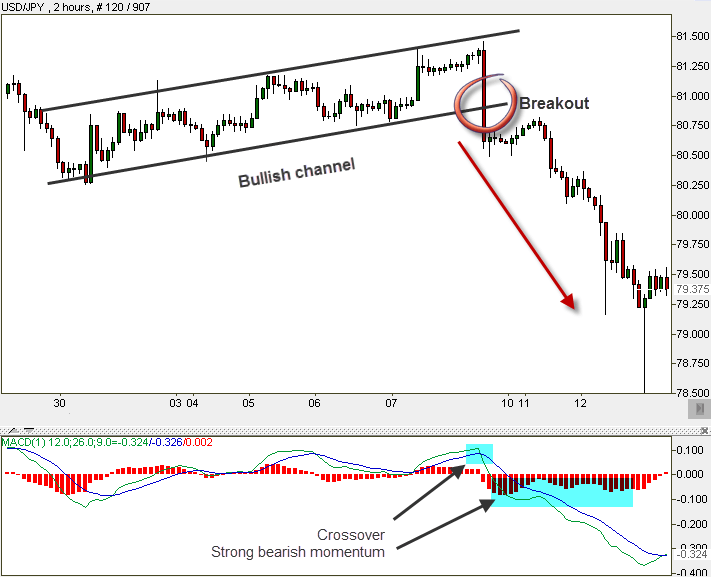
Tip: MACD + Trend line work well together. Combining MACD with Trend line may show strong signals that tell us of a breakout:
Tip: MACD + Channels are also a good combination:
Parabolic SAR
Distinguished from indicators which identify trends’ beginnings, the Parabolic SAR helps identify trends’ endings. This means, the Parabolic SAR catches price changes and reversals on a particular trend.
SAR is extremely simple and friendly to use. It appears in the trading chart as a dotted line. Search for the areas where the price cuts the SAR dots. When the Parabolic SAR goes above the price, we sell (Uptrend ends), and when the Parabolic SAR goes below the price we buy!
EUR/JPY:
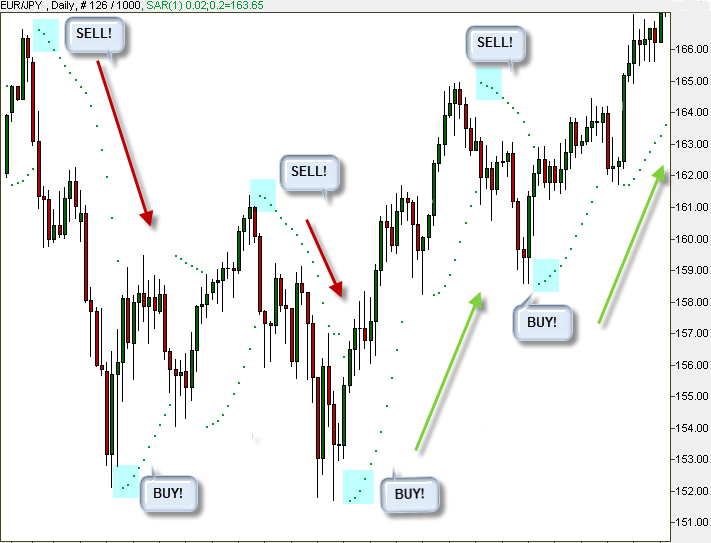
Important: The Parabolic SAR is well suited to markets which are characterized by long-term trends.
Tip: The correct way to use this method: once SAR changes sides with price, wait for three more dots to form (as in the highlighted boxes) before executing.
Pivot Points
Pivot Points are one of the most effective tools for support and resistance among all technical indicators you have learned about. It is advised to use it as a setting point for your Stop Loss and Take Profit orders. Pivot Points calculate the average of the Low, High, Opening and Closing prices of each of the last candlesticks.
Pivot Points work better in the short-term (Intraday and Scalping trades). It is considered to be a very objective tool, similar to Fibonacci, helping us avoid subjective interpretations.
Tip: It is a great tool for traders who wish to enjoy small changes and limited profits in the short-term.
So, how does this tool work? By drawing vertical supports and resistances line:
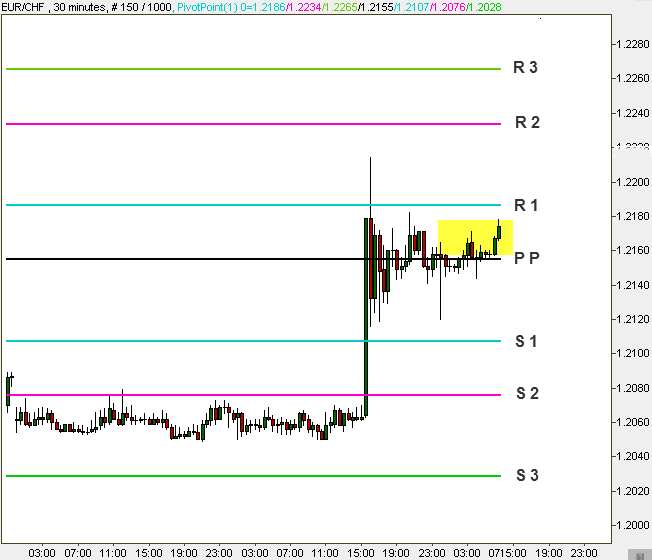
PP = Pivot point ; S = Support ; R = Resistance
Say the price is situated within the support area, we would go long (buy), not forgetting to set a Stop Loss beneath the support level! And vice versa – if the price comes near the resistance area, we would go short (sell)!
Let’s take a look at the chart above: Aggressive traders would set their Stop Loss Order above S1. More conservative traders would set it above S2. The conservative traders will set their Take Profit Order at R1. The more aggressive ones will set it at R2.
Pivot point is a trade zone of balance. It acts as an observation point for other forces operating in the market. When breaking up, the market goes bullish, and when breaking down, the market goes bearish.
The pivot frame is S1/R1 is more common than S2/R2. S3/R3 represents extreme conditions.
Important: As is the case with most indicators, Pivot Points work well with other indicators (raising chances).
Important: Don’t forget – when supports break, they turn into resistances on many occasions, and vice versa.
Summary
We have introduced you to two groups of technical indicators:
- Momentum Indicators: Alert us traders after a trend starts. You can relate to them as informers – letting us know when a trend arrives. Examples of momentum indicators are Moving Averages and MACD.Pros – They are safer to trade with. They score higher results if you learn to use them right.Cons – They sometimes “miss the boat”, showing too late, missing major changes.
- Oscillators: Alert us traders just before a trend starts, or changes direction. You can relate to them as prophets. Examples of oscillators are Stochastic, SAR and RSI.Pros – When hitting the target they provide us with large earnings. Through very early identification, traders enjoy the full trendCons -Prophets are sometimes false prophets. They can cause cases of mistaken identity. They are suitable for risk lovers.
Tip: We strongly recommend getting used to working simultaneously with indicators from both groups. Working with one indicator from each group is very effective. This method restrains us when needed, and it pushes us to take calculated risks on other occasions.
Also, we love working with Fibonacci, Moving Averages and Bollinger Bands. We find the three of them very effective!
Remember: Some indicators we relate to as Support / Resistance levels. Try to remember which ones we are talking about. For instance – Fibonacci and Pivot Points. They are extremely helpful when trying to spot breakouts in order to set entry and exit points.
Let us remind you of the indicators that you found in your toolbox:
- The Fibonacci Indicator.
- Moving Average
- Next in line is… RSI
- Stochastic
- Bollinger Bands
- ADX Trading Strategy
- MACD
- Parabolic SAR
- Last but not least… Pivot Points!
We remind you not to use too many indicators. You should feel good working with 2 or 3 indicators.
Tip: You have already tried and practiced your demo accounts so far. If you wish to open real accounts as well (wish to attempt to get some real deal experience), we recommend opening relatively low budget accounts. Remember, the higher the gain potential, the higher the risk of losing. Anyway, we believe that you should not deposit real money before practicing a bit more and doing the next exercise.
$400 to $1,000 is considered as relatively modest amounts for opening an account. This range can still produce very nice profits for traders, although it is recommended to be extra cautious when trading with these amounts. For those who are extremely eager to open an account no matter what, some brokers allow you to open an account with lower capital, even down to 50 dollars or Euros (Though we do not recommend opening such a small account at all! Chances for nice profits are small, and risks remain the same).
Tip: If you have come to the conclusion that technical analysis is the best way to trade for you, and you are ready to find a good broker and open account, we can recommend on great brokers. Their trading platforms, toolbox and user’s comfort are the best in the industry, along with strong performance and reliability, in our opinion. Click here to visit our recommended brokers.
Practice
Go to your demo account. Let’s practice the subjects that you have learned in this chapter:
.The best advice that we can give you is simply to experience all the indicators that you have learned in the last lesson on your platforms. Remember, demo accounts operate in real time and on real charts from the market. The only difference is that you don’t trade real money on demos! Therefore, it is a fantastic opportunity to practice the technical indicators and trade on virtual money. Work at first with each indicator separately, than, begin trading with two or three indicators simultaneously.
Questions
-
- Bollinger Band: What do you think would happen next?
-
- Moving Averages: What do you think will appear next? (Red line is 20′ and blue is 50′)
- What are the two prominent groups of technical indicators. What is the main difference between them? Give examples for indicators from each group.
- Write down two indicators that act as efficient supports and resistances.
Answers
-
- By noticing the contact between the candles and the lower band, followed by breaking it, we can assume that the sideways trend is about to finish and the shrunken bands are about to expand, with price going down for a downtrend:
-
- Moving Averages
-
- Oscillators (Prophets); Momentum (Informers).
Momentum inform on trades that have just began; Oscillators foresee coming trends.
Momentum- MACD, Moving Average.
Oscillators- RSI, Parabolic SAR, Stochastic, ADX
- bonacci and Pivot Points
Author : Michael Fasogbon
Article Info
Last Updated: November 16th, 2023
Learn to Trade
Never Miss A Trade Again
Signal Notification
Real-time signal notifications whenever a signal is opened, closes or Updated

Get Alerts
Immediate alerts to your email and mobile phone.

Entry Price Levels
Entry price level for every signal Just choose one of our Top Brokers in the list above to get all this free.