
Serivisy ho an'ny varotra kopia. Ny Algo anay dia manokatra sy manidy ny varotra ho azy.
Ny L2T Algo dia manome famantarana tena mahasoa ary misy risika kely indrindra.
24/7 fifanakalozana cryptocurrency. Raha matory ianao dia manao varotra izahay.
Fametrahana 10 minitra miaraka amin'ny tombony lehibe. Ny boky dia omena miaraka amin'ny fividianana.
79% Taham-pahombiazana. Hanentana anao ny vokatray.
Hatramin'ny varotra 70 isam-bolana. Misy pairs mihoatra ny 5 azo alaina.
Manomboka amin'ny £58 ny famandrihana isam-bolana.
Bearish pressure may further increase in S&P 500 market
S&P 500 Price Analysis - 27 Desambra
If the selling pressure picks up, the S&P 500 may breach the $3740 support level, and more pressure from the sellers could drive the price down to $3649 and $3493 levels. Price may reverse and rise toward the resistance levels of $3926, $4087, and $4169 if the support level of $3740 holds
Ambaratonga fototra:
Toe-ponenana: $ 3926, $ 4087, $ 4169
Taham-panohanana: $ 3740, $ 3649, $ 3493
S&P 500 fironana maharitra: Bearish
On the daily chart, the S&P 500 is bearish. When the price surpassed the $4087 barrier mark, the bulls lost their momentum. At the aforementioned level, a minor double-top chart pattern developed; this is a sign that sellers are prepared to take control of the market. The price breached the $3926 support level as the sellers’ pressure grew. Currently, $3740 is being targeted as a support level.
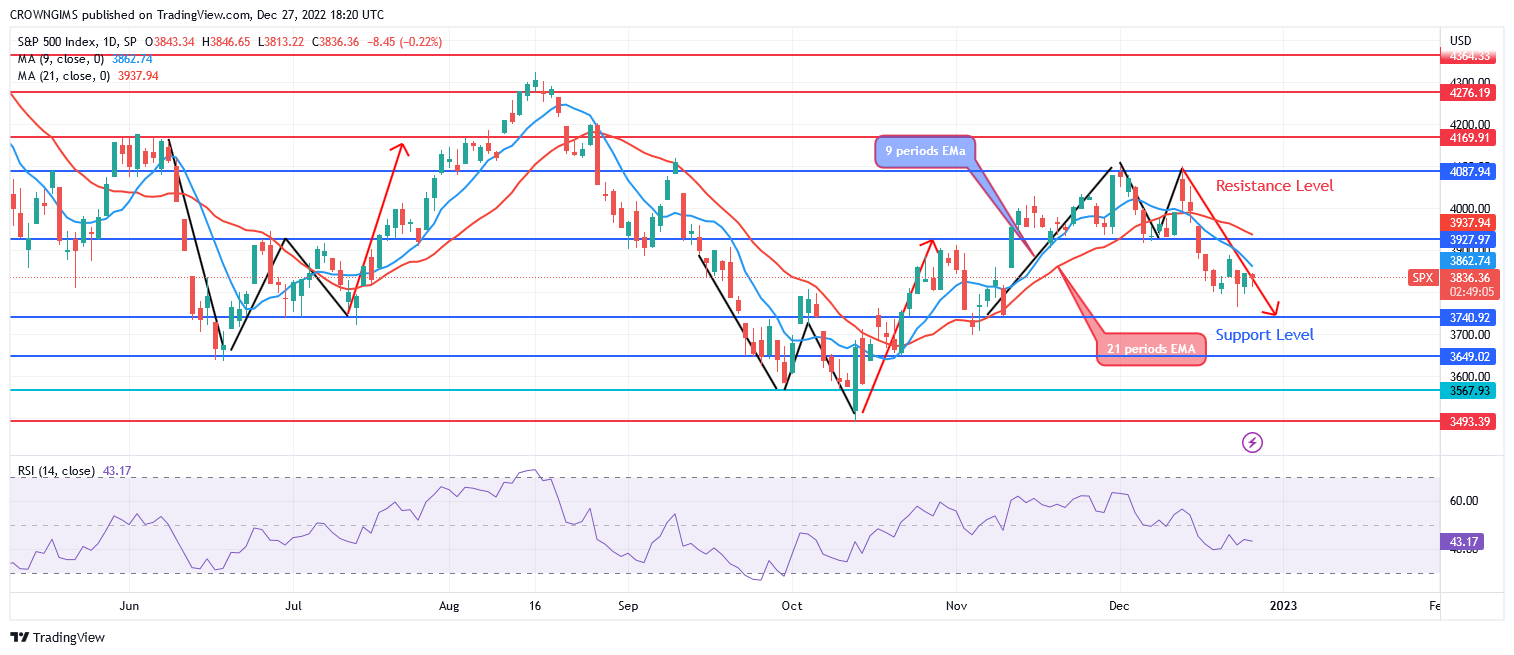
The S&P 500 is trading below both the 9- and 21-period exponential moving averages, which point to bearish momentum. If the selling pressure picks up, the S&P 500 may breach the $3740 support level, and more pressure from the sellers could drive the price down to $3649 and $3493 levels. Price may reverse and rise toward the resistance levels of $3926, $4087, and $4169 if the support level of $3740 holds. With the signal line heading downward and the relative strength index period 14 at 42, a sell signal is being indicated.
S&P 500 Medium-term fironana: Bearish
The S&P 500 is moving bearishly according to the prognosis on the 4-hour chart. In the 4-hour time window, the price movement created an “M” chart pattern. The resistance level of $4087 was reached by the price. The support level of $3937, which it had previously tested, has held. The bearish chart pattern that formed is giving the price direction.
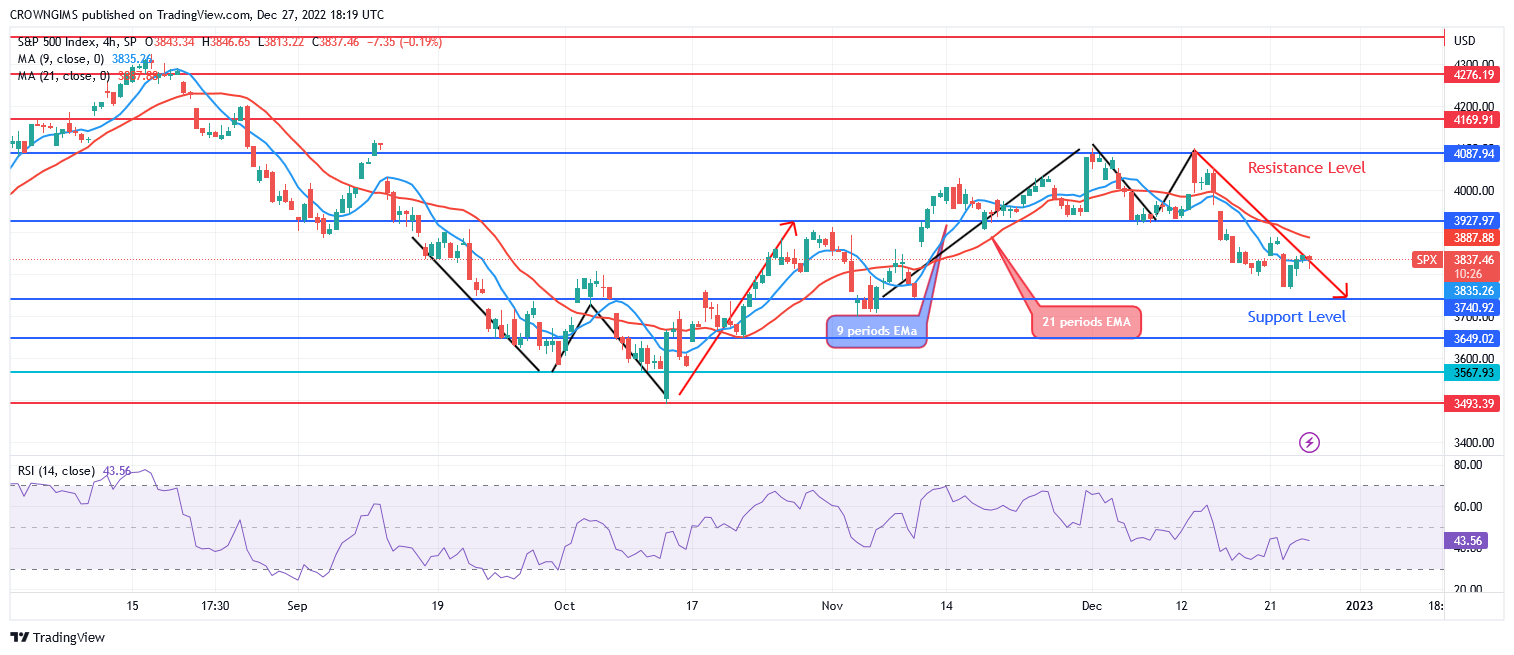
The price is moving in a bearish direction because it is trading below both the 9- and 21-period exponential moving averages. A bearish signal can be seen in the relative strength index period 14 at 41 levels.
Azonao atao ny mividy Lucky Block eto. Vidio ny LBLOCK
- Broker
- Ny petra-bolako
- Maty
- Tsidiho ny Broker

- Sehatra varotra Cryptocurrency nahazo loka
- $ 100 farafahakeliny $ XNUMX,
- Voafehy ny FCA & Cysec

- 20% bonus tonga soa amin'ny $ 10,000 hatrany
- $ 100 farafahakeliny
- Hamarino ny kaontinao alohan'ny hanomezana ny bonus

- Vokatra ara-bola samihafa mihoatra ny 100
- Manambola hatramin'ny $ 10 kely
- Azo atao ny misintona andro iray
- Ny vidin'ny varotra ambany indrindra
- 50% Welcome Bonus
- Fanohanana mandritra ny 24 ora nahazo loka
- Kaonty Fund Moneta Markets miaraka amin'ny $ 250 farafahakeliny
- Misafidiana hampiasa ilay takelaka hitakiana ny bonus 50% apetrakao