
ການບໍລິການສໍາລັບການຊື້ຂາຍສໍາເນົາ. Algo ຂອງພວກເຮົາຈະເປີດ ແລະປິດການຄ້າໂດຍອັດຕະໂນມັດ.
L2T Algo ໃຫ້ສັນຍານທີ່ມີກໍາໄລສູງທີ່ມີຄວາມສ່ຽງຫນ້ອຍ.
ການຊື້ຂາຍ cryptocurrency ຕະຫຼອດ 24 ຊົ່ວໂມງ. ໃນຂະນະທີ່ເຈົ້ານອນ, ພວກເຮົາຊື້ຂາຍ.
ການຕິດຕັ້ງ 10 ນາທີມີຂໍ້ໄດ້ປຽບຢ່າງຫຼວງຫຼາຍ. ຄູ່ມືແມ່ນສະຫນອງໃຫ້ກັບການຊື້.
79% ອັດຕາຜົນສໍາເລັດ. ຜົນໄດ້ຮັບຂອງພວກເຮົາຈະເຮັດໃຫ້ເຈົ້າຕື່ນເຕັ້ນ.
ເຖິງ 70 ການຄ້າຕໍ່ເດືອນ. ມີຫຼາຍກວ່າ 5 ຄູ່.
ການສະໝັກໃຊ້ລາຍເດືອນເລີ່ມຕົ້ນທີ່ £58.
The FTSE 100 market stayed consistent with gains from early January until last Thursday. This performance has seen price action in this market break a long-standing resistance at $7,680. However, it appears that market bulls are getting exhausted, as price action in this market seems bearish at the moment.
ລະດັບລາຄາຫຼັກ:
ລະດັບສູງສຸດ: $7,870, $7,900, $7,930
ລະດັບຊັ້ນ: $7,850, $7,820, $7,790
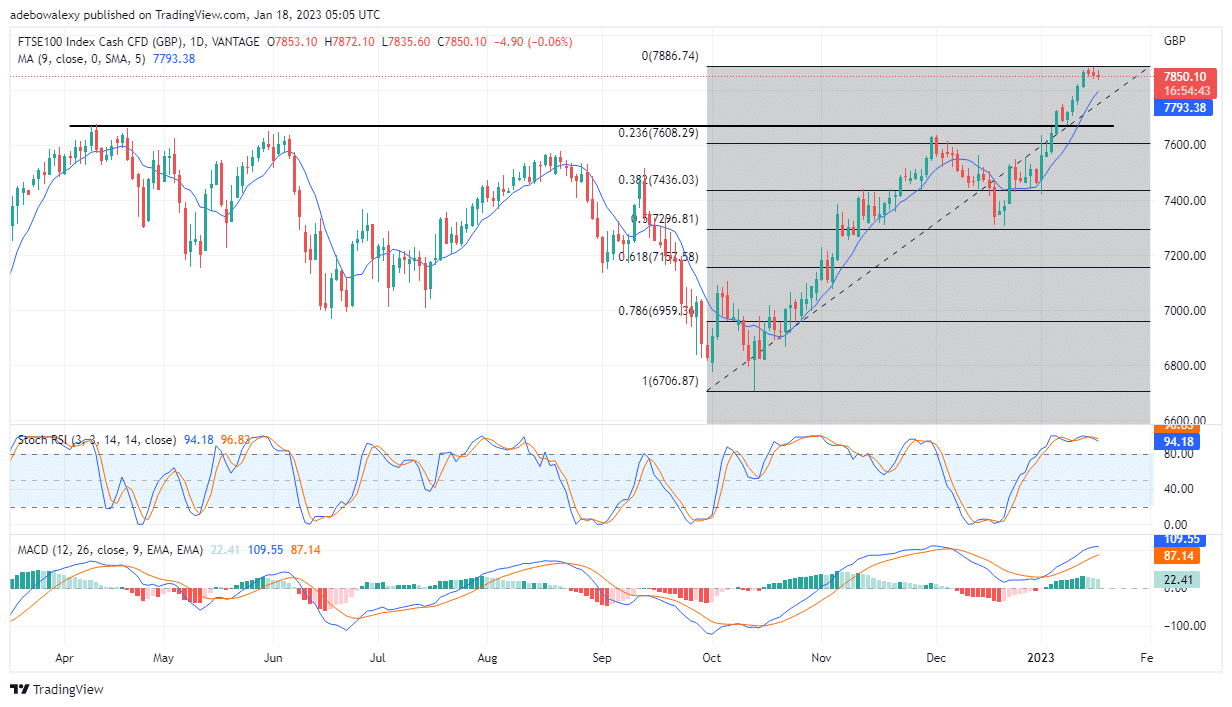
FTSE 100 May Regain Upside Traction
Right from the start of January until last Thursday, the FTSE 100 price rose significantly enough to break a long-term resistance of $7,680. But at this point, this market is retracing lower price levels, which has caused prices to dip to $7,850. Nevertheless, the Stochastic RSI lines are still in the overbought region. However, these lines are now steadily making their way downwards towards the 90 mark of the indicator. Also, the lines of the MACD indicator are still above the equilibrium point at the 109 and 97 marks. But, it is important to know that the histogram bar of the MACD above the 0.00 mark, is now indicating a lack of momentum. This could be seen as these bars are now pale green. And, going by indicator signs here, we may witness prices falling lower in this market.
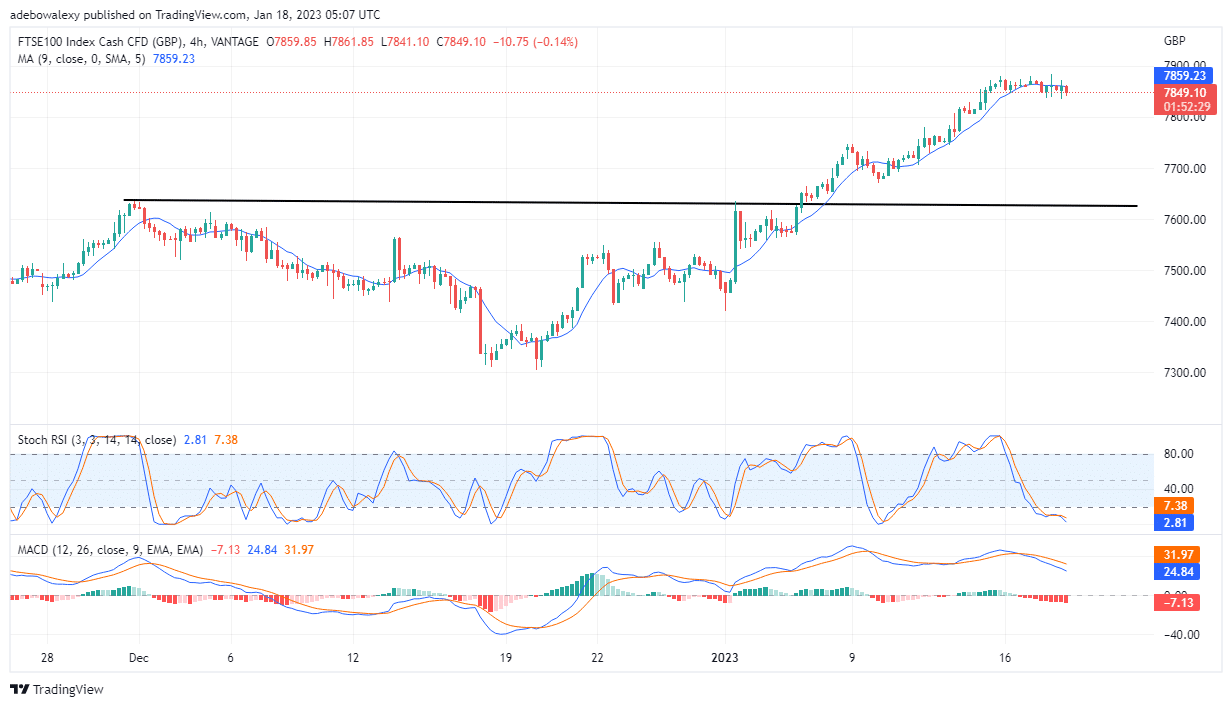
FTSE 100 Price Action Displays Maintains Minimal Bearish Potentials
Price activities on the FTSE 100 4-hour market stay consistent with its minimally bearish characteristics. The last price candle on this chart is a bearish one, and though it only has a bigger body than its previous bullish counterpart which represents the previous trading session, it has pushed the price lower to $7,849. The current FTSE 100 price is now below the 9-day MA line, and this seems to be hinting at the possibility of further price decreases. But even at this small dip in price, the RSI curve has already reached deep into the oversold zone at roughly 7 and 2 levels of the indicator. Likewise, the MACD lines are still above the equilibrium level at the 32 and 25 marks, but its histogram bars have grown significantly below the equilibrium level. Consequently, it appears as if technical indicators here are hypersensitive. Consequently, this may be revealing that the price may not fall too far from here, perhaps to around $7,820.
ທ່ານຕ້ອງການເອົາການຊື້ຂາຍຂອງທ່ານໄປສູ່ລະດັບຕໍ່ໄປບໍ? ເຂົ້າຮ່ວມເວທີທີ່ດີທີ່ສຸດສໍາລັບການນັ້ນທີ່ນີ້.
- ນາຍຫນ້າ
- ເງິນຝາກ Min
- ຜະລິດແນນ
- ຢ້ຽມຢາມນາຍຫນ້າ

- ແພລະຕະຟອມການຄ້າ Cryptocurrency ທີ່ໄດ້ຮັບລາງວັນ
- ເງິນຝາກຂັ້ນຕ່ ຳ $ 100,
- FCA & Cysec ເປັນລະບຽບ

- ເງິນ 20% ຍິນດີຕ້ອນຮັບເຖິງ 10,000 ໂດລາ
- ເງິນຝາກຂັ້ນຕ່ ຳ $ 100
- ຢືນຢັນບັນຊີຂອງທ່ານກ່ອນທີ່ເງິນຈະຖືກໂອນເຂົ້າ

- ຫລາຍກວ່າ 100 ຜະລິດຕະພັນການເງິນທີ່ແຕກຕ່າງກັນ
- ລົງທືນຈາກນ້ອຍເປັນ 10 ໂດລາ
- ການຖອນມື້ດຽວກັນແມ່ນເປັນໄປໄດ້
- ຕົ້ນທຶນການຄ້າຕໍ່າທີ່ສຸດ
- ລາງວັນຍິນດີຕ້ອນຮັບ 50%
- ການສະ ໜັບ ສະ ໜູນ 24 ຊົ່ວໂມງທີ່ໄດ້ຮັບລາງວັນ
- ກອງທຶນບັນຊີຕະຫຼາດ Moneta ມີຕໍາ່ສຸດທີ່ຂອງ $ 250
- ເລືອກໃຊ້ແບບຟອມເພື່ອຂໍເອົາເງິນໂບນັດ 50% ຂອງທ່ານ