
Service fir Kopiehandel. Eis Algo mécht automatesch Handelen op a mécht zou.
De L2T Algo bitt héich rentabel Signaler mat minimale Risiko.
24/7 cryptocurrency Handel. Iwwerdeems Dir schléift, mir Handel.
10 Minutte Setup mat wesentleche Virdeeler. D'Handbuch gëtt mam Kaf geliwwert.
79% Succès Taux. Eis Resultater wäerten Iech begeeschteren.
Bis zu 70 Handel pro Mount. Et gi méi wéi 5 Pairen verfügbar.
Monatlecht Abonnementer fänken u bei £ 58 un.
STELLAR Präis Analyse - Januar 26
When the price break down the support level of $0.16, by the bears’ increased momentum, the price may decrease to the low of $0.11, which may extend to $0.07 level. In case the bears’ pressure are unable to break down the support level of $0.16, bulls may take over and the price may increase towards the $0.20, $0.24 and $0.30 resistance levels.
Schlëssel Niveauen:
Resistenzniveauen: $ 0.20, $ 0.24, $ 0.30
Ënnerstëtzungsniveauen: $ 0.16, $ 0.11, $ 0.07
XLM / USD Langfristeg Trend: Bieresch
On the daily chart, Stellar is bearish. The coin has been obeying the command of sellers for more than three weeks. The support level of $0.24 has been tested and slightly pullback. At the moment, it seems the sellers’ momentum is getting weak as the price is consolidating and pulling back with formation of hammers at the $0.16 zone, closer to the dynamic resistance levels.
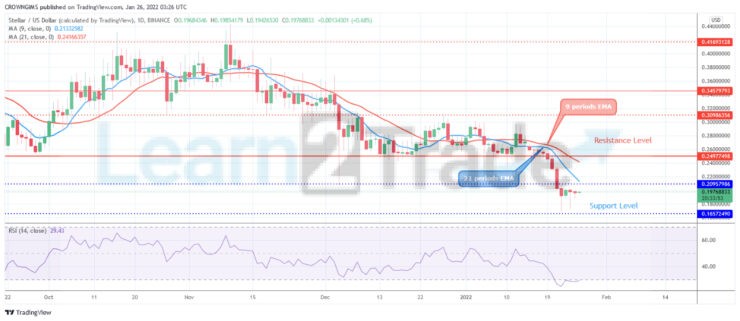
Stellar price is trading below the 9 periods EMA and 21 periods EMA which indicate a bearish momentum. When the price break down the support level of $0.16, by the bears’ increased momentum, the price may decrease to the low of $0.11, which may extend to $0.07 level. In case the bears’ pressure are unable to break down the support level of $0.16, bulls may take over and the price may increase towards the $0.20, $0.24 and $0.30 resistance levels. The relative strength index period 14 is bending up at 20 levels to indicate buy signal.
XLM / USD Mëttelfristeg Trend: Rangéiert
XLM is on the ranging movement in the 4-hour chart. The bears’ momentum and that of the bulls seems to be equal and this is what is causing consolidation in the Stellar market. However, the price action seems to bring out a head and shoulder chart pattern which may be a bullish signal.
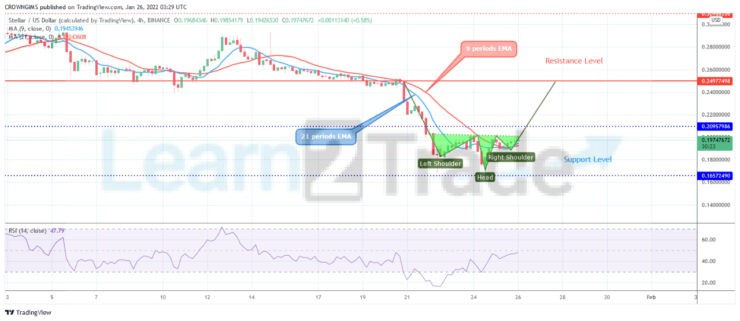
The price is crossing over the 9 periods EMA and the 21 periods EMA as a sign of bullish movement. The Relative Strength Index period 14 is at 50 levels pointing up to indicate buy signal.
Dir kënnt Krypto Mënzen hei kafen: Mënzen kafen
- broker
- Min Depot
- Score
- Besicht de Broker

- Award-Zouschlag Cryptocurrency Handelsplattform
- $ 100 Minimum Depot,
- FCA & Cysec geregelt

- 20% wëllkomm Bonus vu bis zu $ 10,000
- Minimum Depot $ 100
- Verifizéiert Äre Kont ier de Bonus geschriwwe gëtt

- Iwwer 100 verschidde Finanzprodukter
- Investéiert vu sou kleng wéi $ 10
- Deeselwechten Dag Austrëtt ass méiglech
- Fund Moneta Markets Kont mat engem Minimum vun $ 250
- Entscheet Iech mat der Form fir Ären 50% Depot Bonus ze kréien