
Көчүрмө соодасы үчүн кызмат. Биздин Algo сооданы автоматтык түрдө ачып, жаап салат.
L2T Algo минималдуу тобокелдик менен абдан пайдалуу сигналдарды камсыз кылат.
24/7 cryptocurrency соода. Сен уктап жатканда биз соода кылабыз.
олуттуу артыкчылыктары менен 10 мүнөт орнотуу. Колдонмо сатып алуу менен берилет.
79% Ийгилик деңгээли. Биздин жыйынтыктар сизди кубандырат.
Айына 70 соодага чейин. 5 жуптан ашык бар.
Ай сайын жазылуу £58 башталат.
Bitcoin SV бааларын анализдөө - 13-апрель
An increase in the bulls’ momentum may push up the coin to $311 level, which may increase the price to $364 and $410 resistance level. In case the bears exert more pressure and the price close below the support level at $259, then, the price may decrease further to $233 and $217 support levels
BSV / USD базары
Негизги Levels:
Каршылык көрсөткүчтөрү: 285 $, 311 $, 364 $, 410 $
Колдоо деңгээлдери: $ 259, $ 233, $ 217
BSV / USD узак мөөнөттүү тренд: букачар
Bitcoin SV is Bullish on the daily chart. The buyers hold unto the Bitcoin SV market after the breakout that took place on April 01. The crypto was pushed out of the ranging mode and broke up the resistance level of $217. The buyers’ pressure increases and more bullish candles were produced, and the price breaks up the resistance level of $233 and $259. The price is pulling back to retest the broken level of $259.
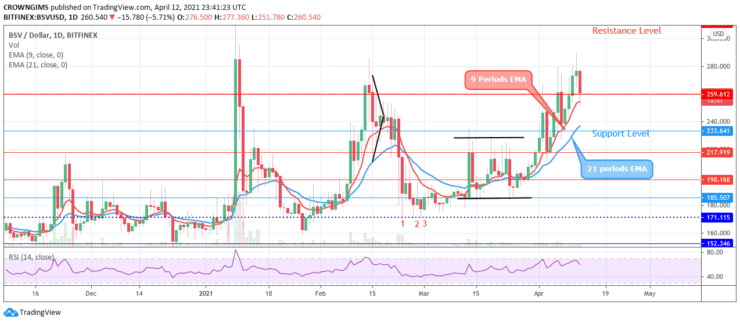
An increase in the bulls’ momentum may push up the coin to $311 level, which may increase the price to $364 and $410 resistance level. In case the bears exert more pressure and the price close below the support level at $259, then, the price may decrease further to $233 and $217 support levels. However, the relative strength index period 14 is at 60 level bending down to indicate sell signal.
BSV / USD орто мөөнөттүү тенденциясы: букачар
Bitcoin SV is bullish on the medium-term outlook. Immediately after the suddenly increase to test the resistance level at $259 on April 02. The bulls had no momentum to sustain the breakout, bears gain more pressure and push down the coin to retest the $217 level. The bulls defend the just mentioned level and the price resume bullish movement to test the resistance level at $285. Price retracement is ongoing towards the $259 level.
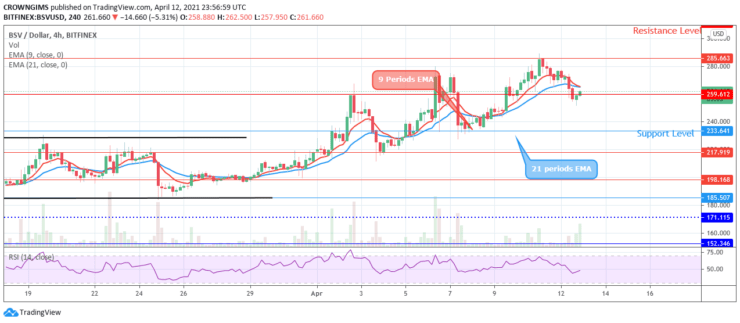
The two EMAs are close to each other and the price is trading above the EMAs which connotes a bullish movement. The relative strength index is displaying a bullish signal at the 50 levels which indicates buy signal.
- брокер
- Min депозиттик
- упай
- Visit брокери

- Сыйлыкка ээ болгон Cryptocurrency соода платформасы
- $ 100 минималдуу депозит,
- FCA & Cysec жөнгө салынат

- 20% саламдашуу бонусу $ 10,000 чейин
- Аманаттын минималдуу суммасы $ 100
- Бонус чегерилгенге чейин өз эсебиңизди текшериңиз

- 100дөн ашуун ар кандай каржылык өнүмдөр
- Болжол менен 10 доллардан инвестиция салыңыз
- Ошол эле күнү чыгууга болот
- Эң төмөнкү соода чыгымдары
- 50% Welcome Bonus
- Сыйлыкка ээ болгон 24 сааттык колдоо
- Fund Moneta Markets эсеби минималдуу $ 250 менен
- 50% депозиттик бонусту талап кылуу үчүн форманы колдонуудан баш тартыңыз