
Xizmeta ji bo bazirganiya kopî. Algo me bixweber bazirganiyê vedike û digre.
L2T Algo sînyalên pir bikêrhatî bi xetereya hindiktirîn peyda dike.
24/7 bazirganiya cryptocurrency. Dema ku hûn radizên, em bazirganiyê dikin.
Sazkirina 10 hûrdemî bi avantajên girîng. Manual bi kirînê re tê pêşkêş kirin.
79% Rêjeya Serkeftinê. Encamên me dê we kêfxweş bike.
Her meh heya 70 bazirganî. Zêdetirî 5 cot hene.
Aboneyên mehane bi 58 £ dest pê dikin.
The USOil price action seems focused on moving higher over the last four trading sessions. And interestingly, price action in this market has been on a progressive upward path. Will this form continue? Let’s check it out.
Astên Bihayê Mezin:
Asta jorîn: $79.00, $80.00, $81.00
Astên qatê: 78.18 $, 77.00 $, 76.00 $
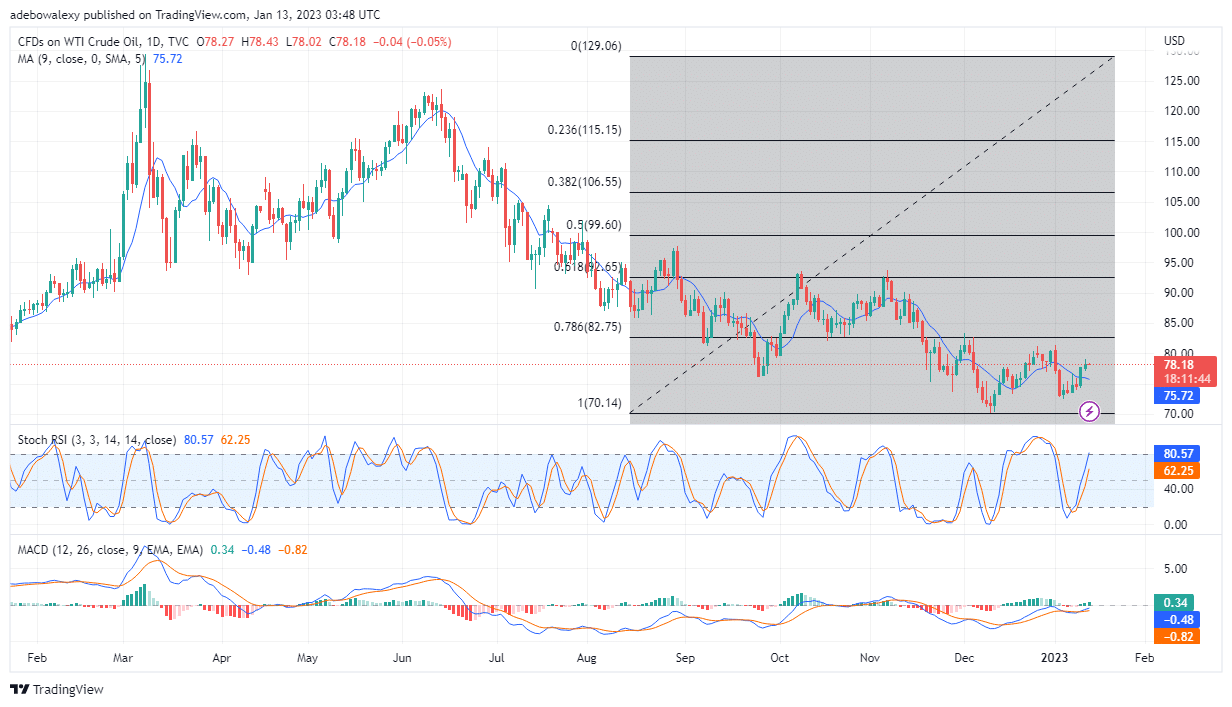
USOil Appears Ready to Extend Its Gain
The technical indicators on the daily USOil 24-hour chart continue to point to potential price increases in this market. The latest price candle on this chart is colored red and reclines significantly above the 9-day MA line, which indicates the effect of downward forces. However, the effect of this candle seems very minimal, as the technical indicators are not pointing out its effect here. The Stochastic RSI lines are still ramping upwards into the overbought zone. Consequently, the activities on the RSI are still indicating that market bulls are still gaining momentum. Likewise, the MACD indicator lines have just performed an upside crossover, and are now moving slightly upwards. Based on signals from trading indicators, one can still predict that prices in this market are on the rise.
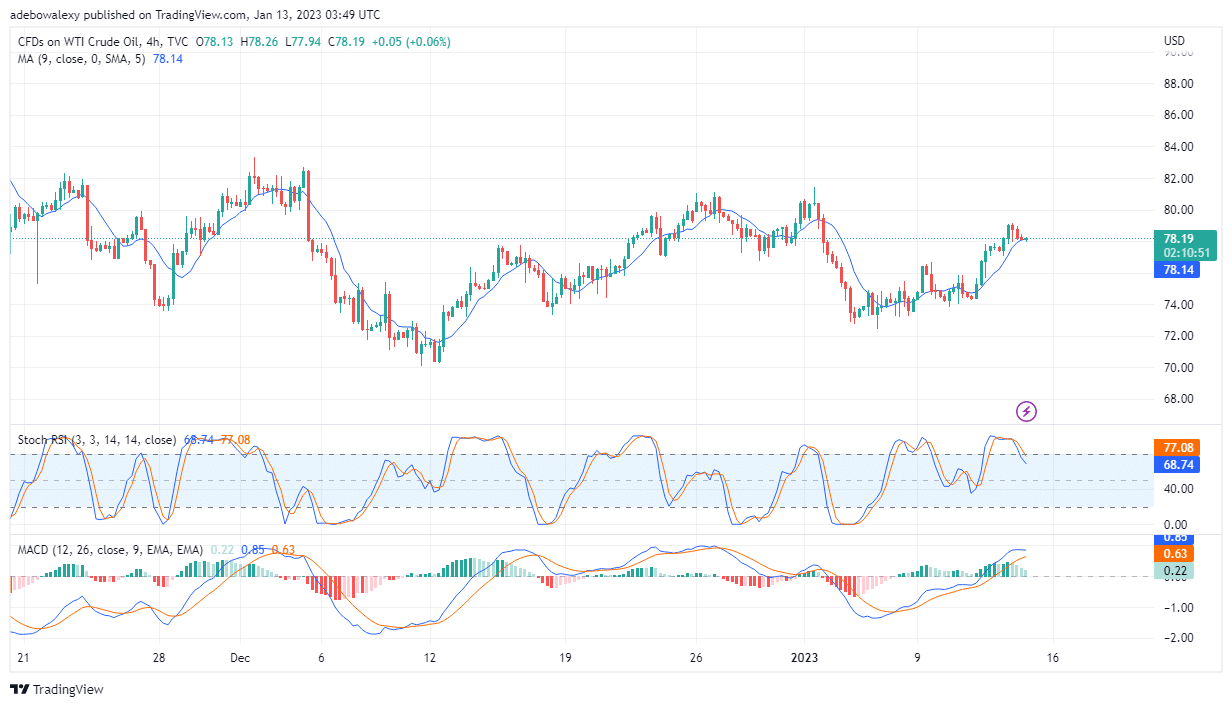
Is USOil Already Attempting to Continue Its Upside Move?
The 4-hour price action for USOil shows that prices in this market have gradually dipped toward the MA line over the last twelve hours. However, in this current session, a green candlestick has appeared and pushed the price just above the MA line. However, given the magnitude of the recorded gain in this market, technical indicators here appear to have detected no signs of a price move to the upside. The stochastic RSI lines are trending downward, and the MACD indicator is also indicating a decrease in upside momentum. The line of the MACD indicator is now moving sideways at 0.83 and 0.63. Nevertheless, traders can still keep their hopes up, as the price may continue its upside path from above the 9-day MA towards the $80.00 price level, as trading activities continues.
Ma hûn dixwazin bazirganiya xwe bigihînin asta din? Ji bo wê li vir beşdarî platforma çêtirîn bibin.
- simsar
- Depozmana Min
- Rewşa nixtan
- Serdana broker

- Platforma bazirganiya Cryptocurrency-ê ya xelatgir
- 100 mîlyon spartinê,
- FCA & Cysec tertîb kirin

- 20% bonus bi xêr hatî upto 10,000 $
- 100 $ kêmtirîn spartinê
- Berî ku bonus neyê hesibandin hesabê xwe rast bikin

- Ser 100 hilberên darayî yên cihêreng
- Ji kêmî 10 $ veberhênanê bikin
- Vekişîna heman rojê gengaz e
- Funda Moneta Markets bi kêmtirîn 250 $ hesab dike
- Bikaranîna formê hilbijêrin da ku hûn 50% bonusa spartinê daxwaz bikin