
Xizmeta ji bo bazirganiya kopî. Algo me bixweber bazirganiyê vedike û digre.
L2T Algo sînyalên pir bikêrhatî bi xetereya hindiktirîn peyda dike.
24/7 bazirganiya cryptocurrency. Dema ku hûn radizên, em bazirganiyê dikin.
Sazkirina 10 hûrdemî bi avantajên girîng. Manual bi kirînê re tê pêşkêş kirin.
79% Rêjeya Serkeftinê. Encamên me dê we kêfxweş bike.
Her meh heya 70 bazirganî. Zêdetirî 5 cot hene.
Aboneyên mehane bi 58 £ dest pê dikin.
S&P 500 market may experience increased bullish pressure
S & P 500 Analysis Price - 10 Çile
S&P 500 dibe ku binpê bike the $3926 resistance level if buying pressure increases, and more buying pressure could push the price as high as $4087 and $4169 levels. If the resistance level of $3926 holds, price may turn around and decline toward the support levels of $3740, $3649, and $3493.
Astên sereke:
Asta berxwedanê: 3926 $, 4087 $, 4169 $
Asta Piştgiriyê: 3740 $, 3649 $, 3493 $
S&P 500 Trendiya demdirêj: Berbiçav
The S&P 500 is in a bullish trend on the daily chart. The bears dominate the S&P 500 market after the bull lost steam at the $4087 barrier threshold. Price declines to the support level of $3740 on 22 December. Bears lose momentum and the bulls also have no enough pressure to drive the price towards the north. Since then, S&P 500 has been trading within $3926 and $3740 levels.
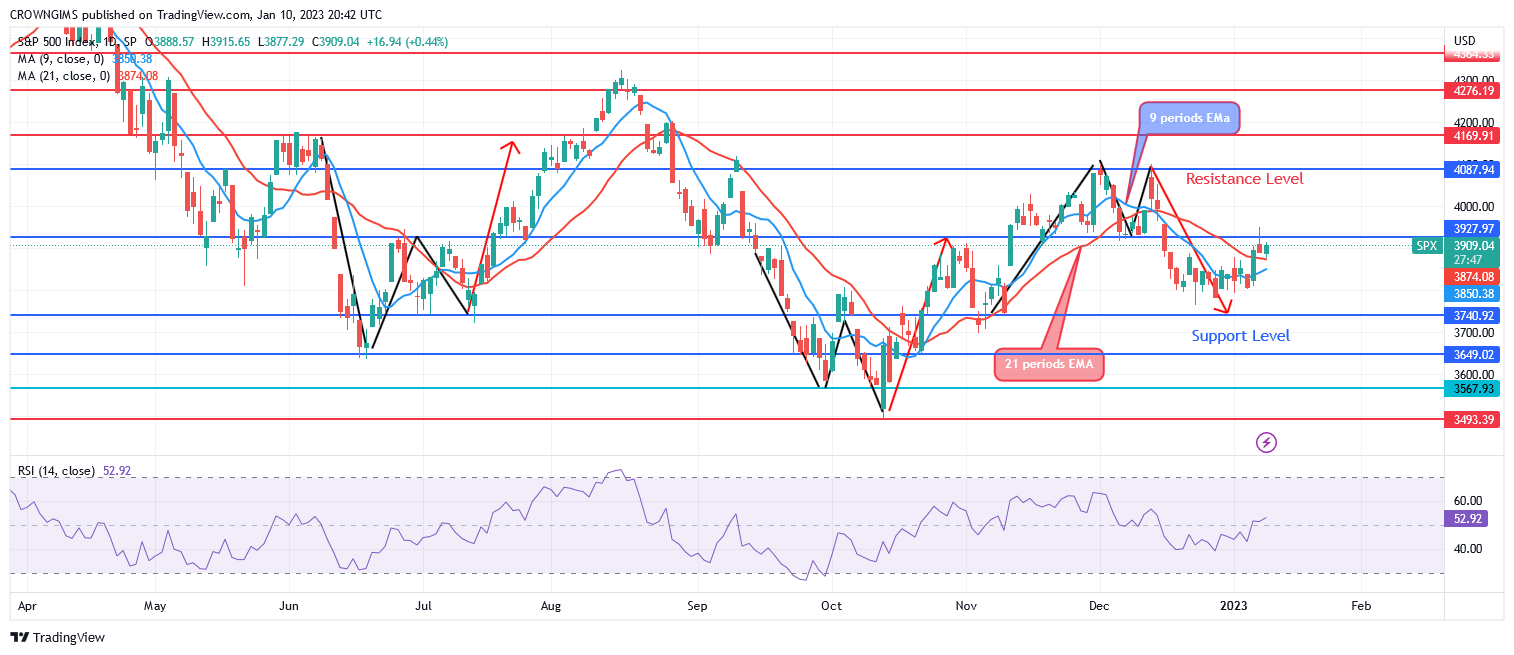
It seems the bearish momentum is getting weak as the S&P 500 is trading above both the 9- and 21-period exponential moving averages. S&P 500 may violate the $3926 resistance level if buying pressure increases, and more buying pressure could push the price as high as $4087 and $4169 levels. If the resistance level of $3926 holds, price may turn around and decline toward the support levels of $3740, $3649, and $3493. A buy signal is being displayed because the Relative Strength Index period 14 is at 53 and the signal line is moving higher.
S&P 500 Trenda Navîn-Demkî: Zordar
The 4-hour chart’s forecast indicates that the S&P 500 is headed upward. The price tested the support level of $3740 and the sellers’ strength became weak. It started a fluctuation trade in the 4-hour. The price started a bullish movement when the bulls gained more momentum. At the moment, the price is struggling to break up the resistance level of $3926.
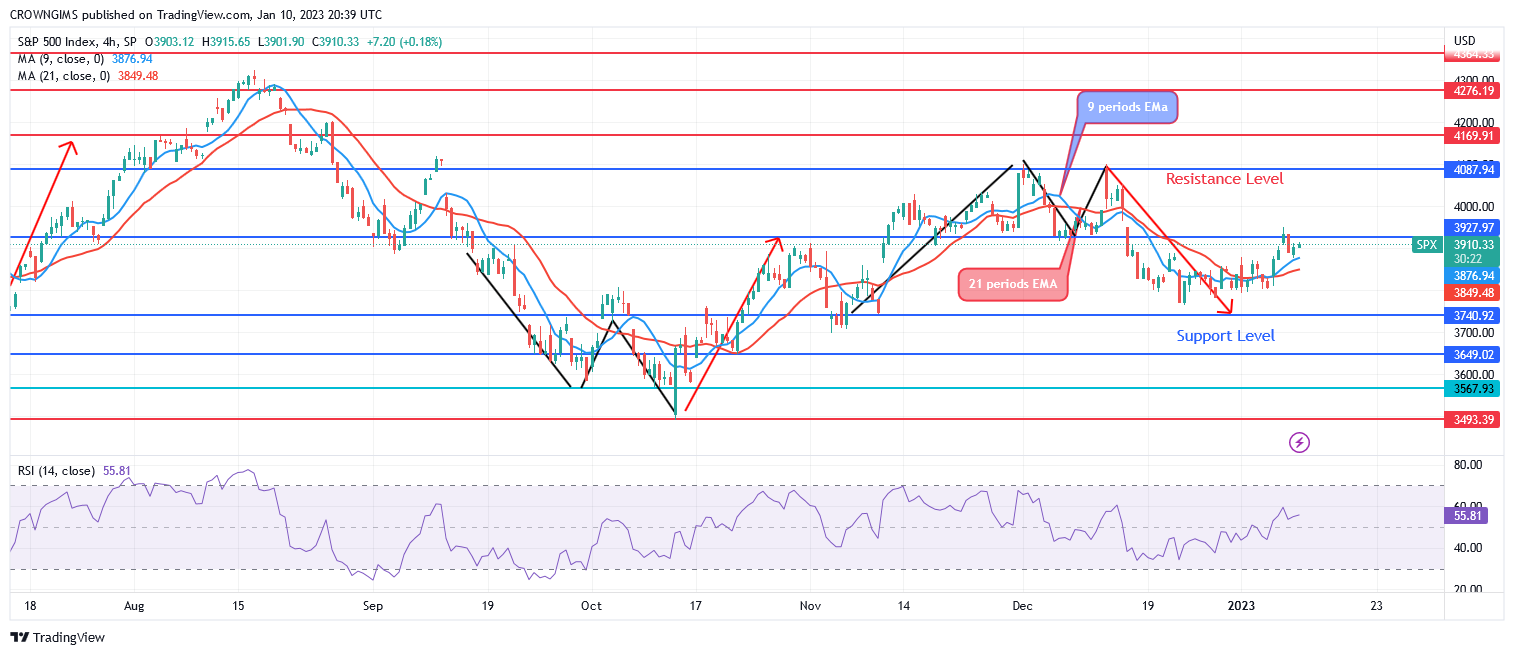
It is trading above both the 9- and 21-period exponential moving averages, the price is heading upward. The Relative Strength Index period 14 at 56 levels display a bullish signal.
Hûn dikarin Lucky Block li vir bikirin. LBLOCK bikirin
- simsar
- Depozmana Min
- Rewşa nixtan
- Serdana broker

- Platforma bazirganiya Cryptocurrency-ê ya xelatgir
- 100 mîlyon spartinê,
- FCA & Cysec tertîb kirin

- 20% bonus bi xêr hatî upto 10,000 $
- 100 $ kêmtirîn spartinê
- Berî ku bonus neyê hesibandin hesabê xwe rast bikin

- Ser 100 hilberên darayî yên cihêreng
- Ji kêmî 10 $ veberhênanê bikin
- Vekişîna heman rojê gengaz e
- Funda Moneta Markets bi kêmtirîn 250 $ hesab dike
- Bikaranîna formê hilbijêrin da ku hûn 50% bonusa spartinê daxwaz bikin