
Xizmeta ji bo bazirganiya kopî. Algo me bixweber bazirganiyê vedike û digre.
L2T Algo sînyalên pir bikêrhatî bi xetereya hindiktirîn peyda dike.
24/7 bazirganiya cryptocurrency. Dema ku hûn radizên, em bazirganiyê dikin.
Sazkirina 10 hûrdemî bi avantajên girîng. Manual bi kirînê re tê pêşkêş kirin.
79% Rêjeya Serkeftinê. Encamên me dê we kêfxweş bike.
Her meh heya 70 bazirganî. Zêdetirî 5 cot hene.
Aboneyên mehane bi 58 £ dest pê dikin.
Bulls continue dominating S&P 500 market
S & P 500 Analysis Price - 24 Çile
The S&P 500 may break through the $4087 resistance level if the buying pressure increases, and more buying pressure might push the price up to $4169 and $4276 levels. If the resistance level of $4087 persists, price may turn around and fall in the direction of the support levels of $3929, $3740, and $3649.
Astên sereke:
Asta berxwedanê: 4087 $, 4169 $, 4276 $
Asta Piştgiriyê: 3929 $, 3740 $, 3649 $
S&P 500 Trendiya demdirêj: Berbiçav
S&P 500 is on a bullish movement on the daily chart. On December 13, buyers drove the price up to the $4087 barrier level. The barrier at the aforementioned level proved to be a roadblock to the bullish trend. At the level, a double top chart pattern developed which resisted purchasers. The price dropped to the $3740 level but was unable to break through it. The resistance level of $3929 was breached last week, and the price is now approaching the high from last month at a level of $4087.
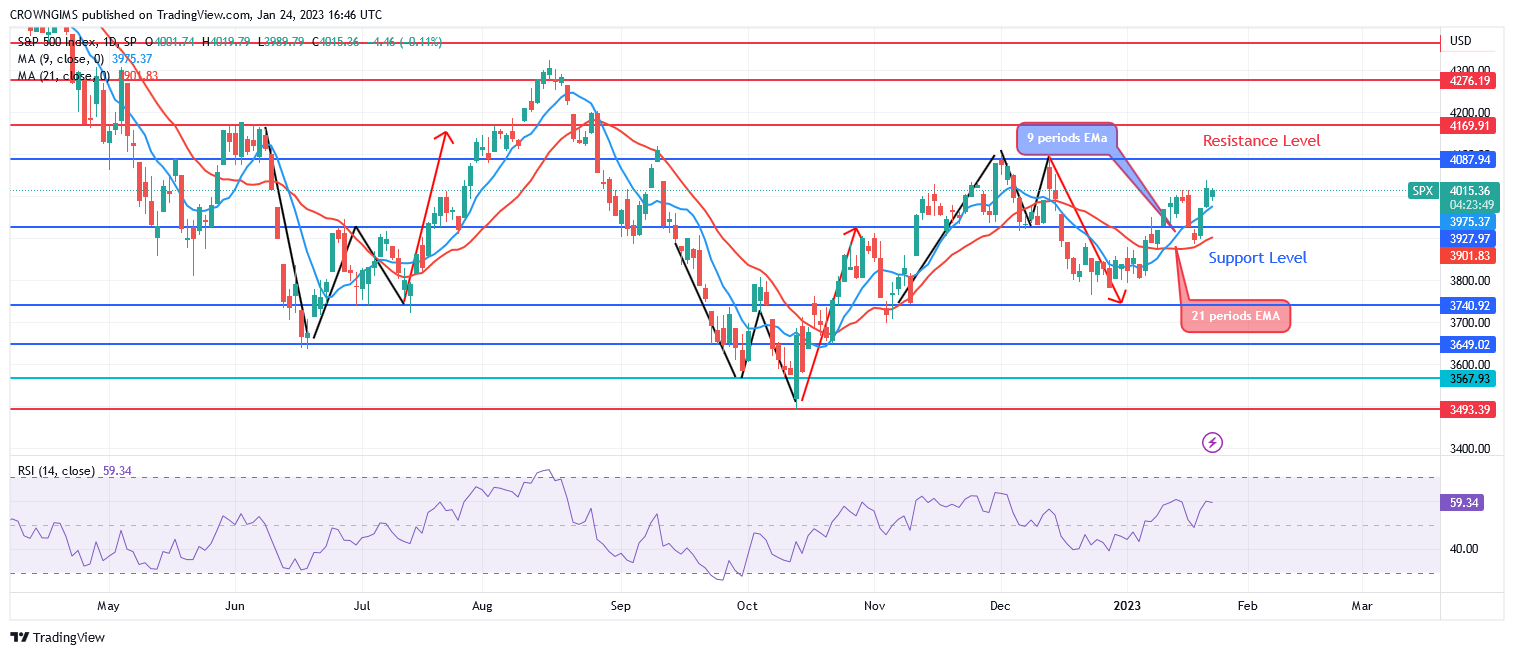
The S&P 500 is currently trading higher than both the 9-period and 21-period exponential moving averages, which suggests bullish momentum. The S&P 500 may break through the $4087 resistance level if the buying pressure increases, and more buying pressure might push the price up to $4169 and $4276 levels. If the resistance level of $4087 persists, price may turn around and fall in the direction of the support levels of $3929, $3740, and $3649. A buy signal is being displayed with the relative strength index period 14 at 59 and the signal line pointing upward.
S&P 500 Trenda Navîn-Demkî: Zordar
The S&P 500 is expected to move upward, according to the projection on the 4-hour chart. The might of the sellers diminished when the price approached the $3740 support level. It started trading variations in the 4-hour. The price started to move upward when the bulls gained greater momentum.
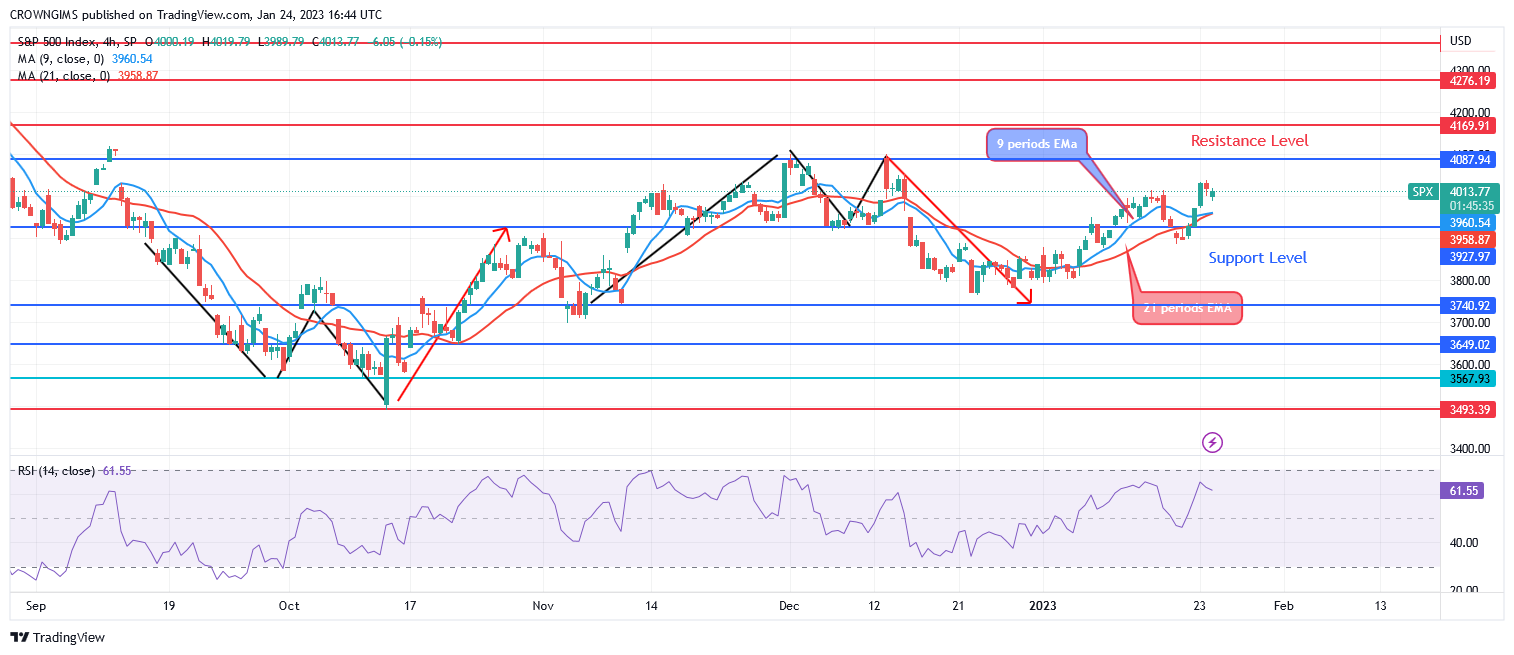
Price is currently seeking for resistance at $4087. The price of the S&P 500 is rising since it is trading above both the 9- and 21-period exponential moving averages. A bullish signal is visible on the Relative Strength Index period 14 at 62 levels.
Hûn dikarin Lucky Block li vir bikirin. LBLOCK bikirin
- simsar
- Depozmana Min
- Rewşa nixtan
- Serdana broker

- Platforma bazirganiya Cryptocurrency-ê ya xelatgir
- 100 mîlyon spartinê,
- FCA & Cysec tertîb kirin

- 20% bonus bi xêr hatî upto 10,000 $
- 100 $ kêmtirîn spartinê
- Berî ku bonus neyê hesibandin hesabê xwe rast bikin

- Ser 100 hilberên darayî yên cihêreng
- Ji kêmî 10 $ veberhênanê bikin
- Vekişîna heman rojê gengaz e
- Funda Moneta Markets bi kêmtirîn 250 $ hesab dike
- Bikaranîna formê hilbijêrin da ku hûn 50% bonusa spartinê daxwaz bikin