
Xizmeta ji bo bazirganiya kopî. Algo me bixweber bazirganiyê vedike û digre.
L2T Algo sînyalên pir bikêrhatî bi xetereya hindiktirîn peyda dike.
24/7 bazirganiya cryptocurrency. Dema ku hûn radizên, em bazirganiyê dikin.
Sazkirina 10 hûrdemî bi avantajên girîng. Manual bi kirînê re tê pêşkêş kirin.
79% Rêjeya Serkeftinê. Encamên me dê we kêfxweş bike.
Her meh heya 70 bazirganî. Zêdetirî 5 cot hene.
Aboneyên mehane bi 58 £ dest pê dikin.
Teknîkî
Astên Berxwedana Mezin - 10 $, 12 $, 14 $
Asta Piştgiriya Mezin - 8 $, 6 $, 4 $
DOT / USD Trend Long-dem: Bullish
Polkadot's (DOT) price is in an upward correction but turns from $9 overhead resistance as it resumes a downtrend. . On the August 9 uptrend; the DOT price was repelled at the high of $9.45 as buyers failed to keep the price above the resistance level. The cryptocurrency is also trading in the overbought region of the market. Polkadot will rise to $10.80 and $12 price levels if the bulls break the resistance at $9, On the other hand, if the bulls fail to break the overhead resistance, the altcoin will decline and find support above the $7.68 support. However, the downtrend will resume if the DOT price retraces and breaks below the moving average lines. The altcoin will further decline to the low of $6.52 price level.
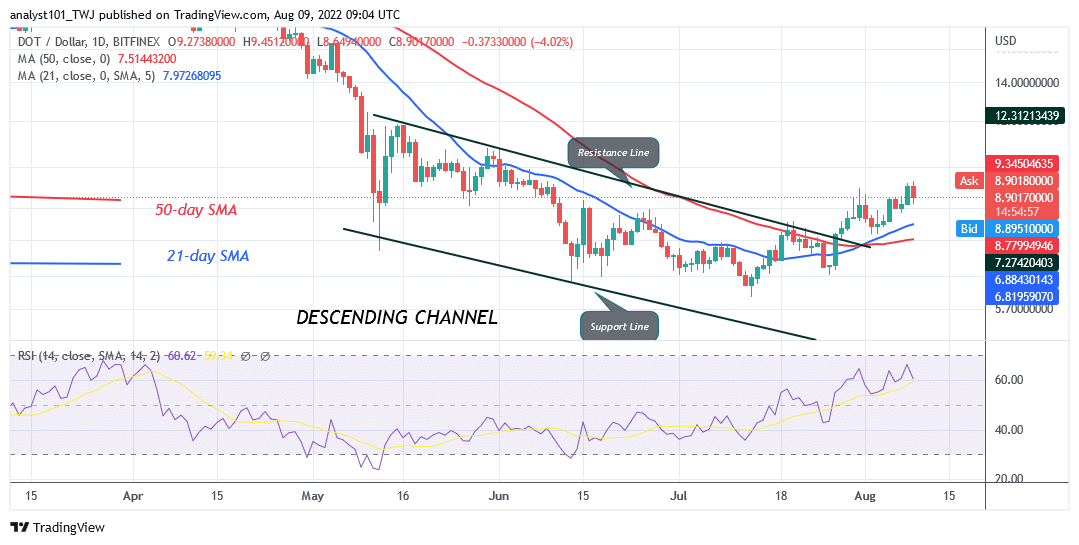
Xwendina Nîşandanên Qerta Rojane:
DOT is at level 60 of the Relative Strength Index for period 14. It indicates that the price is in the bullish trend zone and may further rise. The price is above the 21-day line SMA and 50-day line SMA which implies a further upward move.
DOT / USD bias navîn-dema: Bearish
On the 4– hour chart, the DOT price is in a downward correction. It is facing rejection at level $9.39. Meanwhile, on the August 9 downtrend, a retraced candle body tested the 78.6% Fibonacci retracement level. It indicates that DOT will fall but reverse at level 1.272 Fibonacci extension or $8.45 price level.
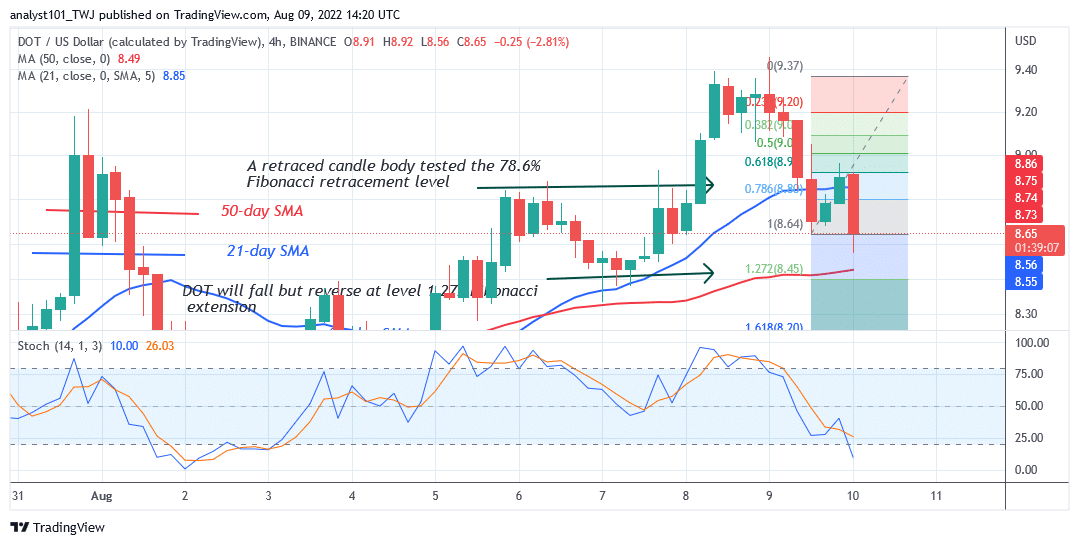
Xwendina Nîşanên Chart 4-saetî
The altcoin is below the 20 % range of the daily stochastic. It indicates that the coin has fallen to the oversold region. The 21-day line and 50-day line moving averages are sloping upward indicating the uptrend.
Outlook Giştî ya ji bo Polkadot
Polkadot is in an upward move but turns from $9 overhead resistance as it resumes a downtrend. The cryptocurrency is trading in the overbought region of the market, hence the attraction of sellers. On the daily chart, the uptrend will resume if price finds support above the moving average lines.
Hûn dikarin li vir dravên krîpto bikirin: LBlock bikirin
Not: Learn2.Trade ne şêwirmendê darayî ye. Lêkolîna xwe bikin berî ku we fonên xwe li ser sermayeyek darayî an berhem an bûyerek pêşkêşkirî veberhênin. Em ji encamên we yên veberhênanê berpirsiyar nînin
- simsar
- Depozmana Min
- Rewşa nixtan
- Serdana broker

- Platforma bazirganiya Cryptocurrency-ê ya xelatgir
- 100 mîlyon spartinê,
- FCA & Cysec tertîb kirin

- 20% bonus bi xêr hatî upto 10,000 $
- 100 $ kêmtirîn spartinê
- Berî ku bonus neyê hesibandin hesabê xwe rast bikin

- Ser 100 hilberên darayî yên cihêreng
- Ji kêmî 10 $ veberhênanê bikin
- Vekişîna heman rojê gengaz e
- Funda Moneta Markets bi kêmtirîn 250 $ hesab dike
- Bikaranîna formê hilbijêrin da ku hûn 50% bonusa spartinê daxwaz bikin