Xizmeta ji bo bazirganiya kopî. Algo me bixweber bazirganiyê vedike û digre.
L2T Algo sînyalên pir bikêrhatî bi xetereya hindiktirîn peyda dike.
24/7 bazirganiya cryptocurrency. Dema ku hûn radizên, em bazirganiyê dikin.
Sazkirina 10 hûrdemî bi avantajên girîng. Manual bi kirînê re tê pêşkêş kirin.
79% Rêjeya Serkeftinê. Encamên me dê we kêfxweş bike.
Her meh heya 70 bazirganî. Zêdetirî 5 cot hene.
Aboneyên mehane bi 58 £ dest pê dikin.
The multiple time frames trading strategy is a Forex trading strategy that works by following a single currency pair over different time frames. By following the price chart we can see the highs and lows and establish the overall and temporary trend. However, by looking at the different time frames we can see changes and patterns that we were not able to spot by using a single time frame.
4
çalak
Platformên bazirganî
Tertîb kirin ji hêla
Alîkarî
Min.Deposit
Leverage max
Pairs Exchange
Bisinifkirinî
App Mobile
Rating
Bi tevahî mesref
$ 0
![]() Simsarî
3.5
Simsarî
3.5
Min.Deposit
$100
Min belav bike.
Variables pips
Leverage max
100
Pairs Exchange
40
Platformên bazirganî
Methodên Binesaziyê


Tertîb kirin ji hêla
FCA
Tiştê ku hûn dikarin bazirganî bikin
Forex
Indices
Actions
Cryptocurrencies
Raw Materials
Average belav
EUR / GBP
-
EUR / USD
-
EUR / JPY
0.3
EUR / CHF
0.2
GBP / USD
0.0
GBP / JPY
0.1
GBP / CHF
0.3
USD / JPY
0.0
USD / CHF
0.2
CHF / JPY
0.3
Heqê Additional
Rêjeya berdewam
guherbarên
Veguheztin
Variables pips
rêziknameya
Erê
FCA
Na
CYSEC
Na
ASIC
Na
KGK
Na
NFA
Na
BAFIN
Na
CMA
Na
SCB
Na
DFSA
Na
CBFSAI
Na
BVIFSC
Na
FSCA
Na
Artêşa Azad
Na
FFAJ
Na
ADGM
Na
FRSA
71% hesabên veberhênerê firotanê dema ku CFD-an bi vê dabînkerê re bazirganî dikin drav winda dikin.
Rating
Bi tevahî mesref
$ 0
![]() Simsarî
0
Simsarî
0
Min.Deposit
$100
Min belav bike.
- pips
Leverage max
400
Pairs Exchange
50
Platformên bazirganî
Methodên Binesaziyê
Tertîb kirin ji hêla
CYSECASICCBFSAIBVIFSCFSCAArtêşa AzadFFAJADGMFRSA
Tiştê ku hûn dikarin bazirganî bikin
Forex
Indices
Actions
Cryptocurrencies
Raw Materials
Etfs
Average belav
EUR / GBP
1
EUR / USD
0.9
EUR / JPY
1
EUR / CHF
1
GBP / USD
1
GBP / JPY
1
GBP / CHF
1
USD / JPY
1
USD / CHF
1
CHF / JPY
1
Heqê Additional
Rêjeya berdewam
-
Veguheztin
- pips
rêziknameya
Na
FCA
Erê
CYSEC
Erê
ASIC
Na
KGK
Na
NFA
Na
BAFIN
Na
CMA
Na
SCB
Na
DFSA
Erê
CBFSAI
Erê
BVIFSC
Erê
FSCA
Erê
Artêşa Azad
Erê
FFAJ
Erê
ADGM
Erê
FRSA
71% hesabên veberhênerê firotanê dema ku CFD-an bi vê dabînkerê re bazirganî dikin drav winda dikin.

Rating
Bi tevahî mesref
$ 0
![]() Simsarî
6.00
Simsarî
6.00
Min.Deposit
$10
Min belav bike.
- pips
Leverage max
10
Pairs Exchange
60
Platformên bazirganî
Methodên Binesaziyê
Tiştê ku hûn dikarin bazirganî bikin
Forex
Indices
Cryptocurrencies
Average belav
EUR / GBP
1
EUR / USD
1
EUR / JPY
1
EUR / CHF
1
GBP / USD
1
GBP / JPY
1
GBP / CHF
1
USD / JPY
1
USD / CHF
1
CHF / JPY
1
Heqê Additional
Rêjeya berdewam
-
Veguheztin
- pips
rêziknameya
Na
FCA
Na
CYSEC
Na
ASIC
Na
KGK
Na
NFA
Na
BAFIN
Na
CMA
Na
SCB
Na
DFSA
Na
CBFSAI
Na
BVIFSC
Na
FSCA
Na
Artêşa Azad
Na
FFAJ
Na
ADGM
Na
FRSA
Paytexta we di xetereyê de ye.
Rating
Bi tevahî mesref
$ 0
![]() Simsarî
0.1
Simsarî
0.1
Min.Deposit
$50
Min belav bike.
- pips
Leverage max
500
Pairs Exchange
40
Platformên bazirganî
Methodên Binesaziyê
Tiştê ku hûn dikarin bazirganî bikin
Forex
Indices
Actions
Raw Materials
Average belav
EUR / GBP
-
EUR / USD
-
EUR / JPY
-
EUR / CHF
-
GBP / USD
-
GBP / JPY
-
GBP / CHF
-
USD / JPY
-
USD / CHF
-
CHF / JPY
-
Heqê Additional
Rêjeya berdewam
-
Veguheztin
- pips
rêziknameya
Na
FCA
Na
CYSEC
Na
ASIC
Na
KGK
Na
NFA
Na
BAFIN
Na
CMA
Na
SCB
Na
DFSA
Na
CBFSAI
Na
BVIFSC
Na
FSCA
Na
Artêşa Azad
Na
FFAJ
Na
ADGM
Na
FRSA
71% hesabên veberhênerê firotanê dema ku CFD-an bi vê dabînkerê re bazirganî dikin drav winda dikin.
Find out more about Trend Trading – Forex Trading Strategies
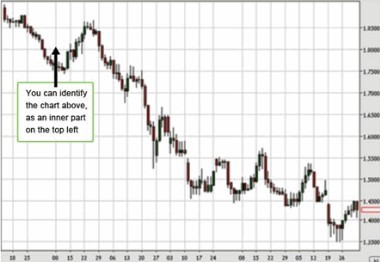
In the chart above every candlestick represents 2 hours. The chart consists of 360 candlesticks that altogether constitute 1 full month.
Learn more about Candlestick – Forex Trading Strategies
On the left side of the chart, marked with purple markings, are mini-trends. If we would have looked at a shorter time frame we would have seen these mini-trends but would not have seen the bigger picture which shows a much larger bullish trend.
Now let’s look at an even larger time frame and see how it affects our understanding of the trend.
This is a chart of a half-year time frame. Each candlestick on this chart represents 1 day. As you can see, what we analyzed as a bullish trend appears in this time frame to be just a small pullback of an overall bearish trend.
Clearly, when looking at a single time frame you can’t know the whole story. As a rule, it is critical to know the whole story before making an investment. Examining the price change over numerous time frames can act as an indicator in telling us when to enter or exit a trade.
Standard time frames to focus on are time frames in which each candlestick represents 15 minutes, 30 minutes or 1 hour. These time frames fall right in the middle as they allow the trader enough time to examine the market before making a move but are not too long-term, making them profitable over relatively short periods of time.
To sum up, each time frame has its benefits. Long time frames allow us to understand the bigger picture and identify the overall trend. Average time frames present the short term trend and show us what is happening in the market right now. Short time frames are our way of recognizing the exact window for when to make our move.
To successfully execute multiple time frame analysis, the suggested working process is to choose a time frame to work in and then verify your move with a longer time frame. Working with three different time frames is possible. However, be careful when working with three or more time frames as it can cause a great deal of confusion and chart mix-ups.