
Xizmeta ji bo bazirganiya kopî. Algo me bixweber bazirganiyê vedike û digre.
L2T Algo sînyalên pir bikêrhatî bi xetereya hindiktirîn peyda dike.
24/7 bazirganiya cryptocurrency. Dema ku hûn radizên, em bazirganiyê dikin.
Sazkirina 10 hûrdemî bi avantajên girîng. Manual bi kirînê re tê pêşkêş kirin.
79% Rêjeya Serkeftinê. Encamên me dê we kêfxweş bike.
Her meh heya 70 bazirganî. Zêdetirî 5 cot hene.
Aboneyên mehane bi 58 £ dest pê dikin.
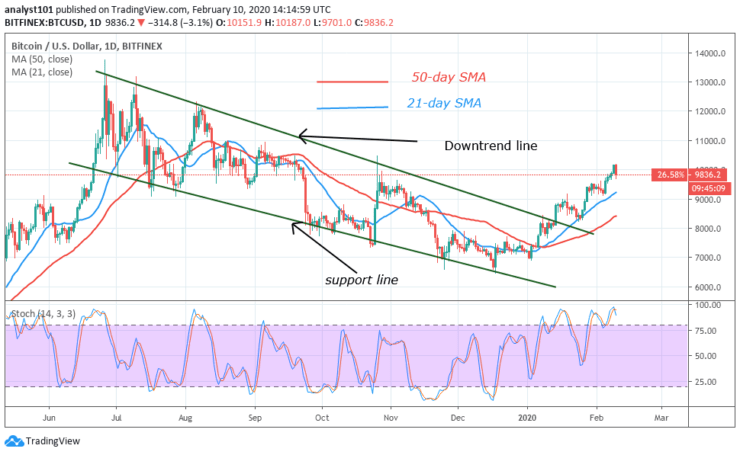
Herêmên Piştgiriya Key: $ 7, 000, $ 6, 000, $ 5,000
BTC / USD Trend-a Dirêj-Bendewar: Zordar
Yesterday, Bitcoin traded and climbed above the $10,000 price level. The upward move to the new high was short-lived as the bulls were resisted. The bulls were resisted at a high of $10,165 and the coin fell to the low of $9,812 at the time of writing. It appears the current low is holding as the bulls make an upward movement. The original target of the bulls is the $10,360 price level.
On the upside, if the coin picks up momentum, the bulls will be able to push the price above $10,200 resistance. If successful the momentum can be sustained. Then Bitcoin will be able to attain a high of $10,360. Conversely, if the downward move continues or the bears may break below $9,812 support, BTC may drop to the low of $9,400 or $9,200.
Xwendina Nîşandanên Qerta Rojane:
Bitcoin has been on a downward move because the coin is trading above 80% range of daily stochastic. The stochastic bands are making a U-turn downward. This indicates that BTC is in the overbought region of the market. This is the region where sellers are generated to push the price downward. Bitcoin is falling as a result of the absence of buyers. The upward move may continue as soon the coin finds support.
Trenda Navîn-BTC / USD: Zordar
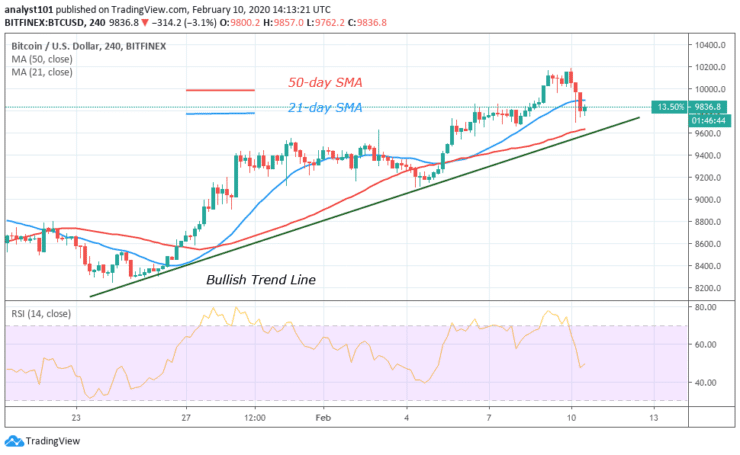
On the 4 hour chart, Bitcoin reaches a high of $10,200. The bulls were resisted after testing the resistance on two occasions. The coin fell to a low of $9,802 support. Incidentally, this was the previous resistance where the bulls had broken in time past. If the bears break this current level the selling pressure will resume.
Xwendina Nîşanên Chart 4-saetî
Bitcoin has fallen to level 47 of the Relative Strength Index period 14. This indicates that the coin is below the center line 50. Bitcoin is now a downtrend zone. On the downside, if the selling pressure continues and breaks the bullish trend line, the uptrend is said to be terminated.
Dîtina Giştî ya Bitcoin (BTC)
On the daily chart, the price is still above the 50-day and 21-day SMAs which indicates that the uptrend is ongoing. Bitcoin will find support and resume the upward move. The $9,800 support is likely to hold. If it holds, the uptrend will resume. Conversely, if the support cracks, Bitcoin will depreciate further.
Nîşana Bazirganî ya BTC
Amûr: BTC / USD
Ferman: Kirîn
Bihayê têketinê: 9,817 $
Rawestandin: 9,700 $
Armanc: 10,300 $
Not: Learn2Trade.com ne şêwirmendê darayî ye. Lêkolîna xwe bikin berî veberhênana draviyên xwe di sermayeyek darayî de an hilberek an bûyerek pêşkêşkirî. Em ji encamên we yên veberhênanê berpirsiyar nînin
- simsar
- Depozmana Min
- Rewşa nixtan
- Serdana broker

- Platforma bazirganiya Cryptocurrency-ê ya xelatgir
- 100 mîlyon spartinê,
- FCA & Cysec tertîb kirin

- 20% bonus bi xêr hatî upto 10,000 $
- 100 $ kêmtirîn spartinê
- Berî ku bonus neyê hesibandin hesabê xwe rast bikin

- Ser 100 hilberên darayî yên cihêreng
- Ji kêmî 10 $ veberhênanê bikin
- Vekişîna heman rojê gengaz e
- Funda Moneta Markets bi kêmtirîn 250 $ hesab dike
- Bikaranîna formê hilbijêrin da ku hûn 50% bonusa spartinê daxwaz bikin