
Xizmeta ji bo bazirganiya kopî. Algo me bixweber bazirganiyê vedike û digre.
L2T Algo sînyalên pir bikêrhatî bi xetereya hindiktirîn peyda dike.
24/7 bazirganiya cryptocurrency. Dema ku hûn radizên, em bazirganiyê dikin.
Sazkirina 10 hûrdemî bi avantajên girîng. Manual bi kirînê re tê pêşkêş kirin.
79% Rêjeya Serkeftinê. Encamên me dê we kêfxweş bike.
Her meh heya 70 bazirganî. Zêdetirî 5 cot hene.
Aboneyên mehane bi 58 £ dest pê dikin.
Herêmên Piştgiriya Key: $ 7, 000, $ 6, 000, $ 5,000
BTC / USD Trend-a Dirêj-Bendewar: Zordar
After February 11 breakouts, Bitcoin has been characterized by small body candlesticks like Doji and spinning tops. These candlesticks describe the indecision between the buyers and sellers concerning the direction of the market. The price is now fluctuating in a tight range between $10,200 and $10,400. This is the fourth day of indecision between the bulls and the bears.
Can we expect the bulls to break the next major resistance at $10,360? Then continue with the upward move. Or allow the bears to erase the bullish gains and take us back to the bear market? Definitely, in a matter of days, the $10,200 support or $10, 400 resistance will be broken to know the direction of Bitcoin. Meanwhile, Bitcoin is in consolidation above $10,200 support.
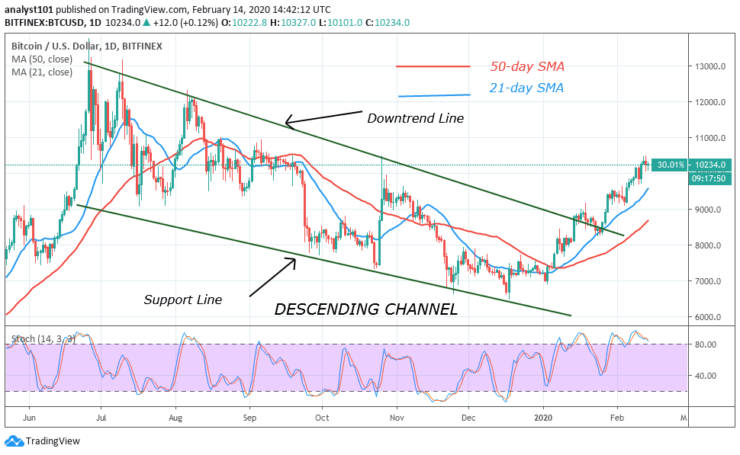
Xwendina Nîşandanên Qerta Rojane:
Bitcoin has consistently remained to trade in the overbought region of the daily stochastic since on January 29. In the overbought region, the price is sloping between 95% and 80% range. This makes the bullish momentum to linger in the overbought region. Meanwhile, as soon as the bullish momentum is exhausted, sellers will take control in the overbought region.
Trenda Navîn-BTC / USD: Zordar
On the 4 hour chart, the market has remained the same in the last four days. The bulls and bears have failed to breach the respective levels as the market continues its range-bound movement. The bears have carefully defended the $10,400 price level. Similarly, the bulls are also putting the bears far away from the current support.
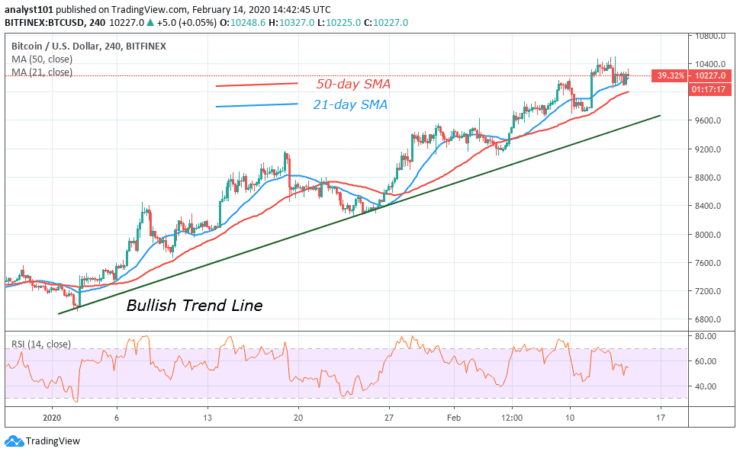
Xwendina Nîşanên Chart 4-saetî
The Relative Strength Index period 14 level 56 indicates that Bitcoin is in an uptrend zone. The coin is above the centerline 50 which indicates that the coin will rise. The 21-day and 50-day SMAs are sloping horizontally indicating the uptrend.
Dîtina Giştî ya Bitcoin (BTC)
Bitcoin is now in consolidation above $10,200 as the bulls fail to break the next major resistance. The RSI period 14 and the daily stochastic have all indicated that the price is in the uptrend zone. The market intends to rise. As the market continues its consolidation, we should expect a breakout and breakdown.
Nîşana Bazirganî ya BTC
Amûr: BTC / USD
Ferman: Kirîn
Bihayê têketinê: 10,234 $
Rawestandin: 10,000 $
Armanc: 11,000 $
Not: Learn2Trade.com ne şêwirmendê darayî ye. Lêkolîna xwe bikin berî veberhênana draviyên xwe di sermayeyek darayî de an hilberek an bûyerek pêşkêşkirî. Em ji encamên we yên veberhênanê berpirsiyar nînin
- simsar
- Depozmana Min
- Rewşa nixtan
- Serdana broker

- Platforma bazirganiya Cryptocurrency-ê ya xelatgir
- 100 mîlyon spartinê,
- FCA & Cysec tertîb kirin

- 20% bonus bi xêr hatî upto 10,000 $
- 100 $ kêmtirîn spartinê
- Berî ku bonus neyê hesibandin hesabê xwe rast bikin

- Ser 100 hilberên darayî yên cihêreng
- Ji kêmî 10 $ veberhênanê bikin
- Vekişîna heman rojê gengaz e
- Funda Moneta Markets bi kêmtirîn 250 $ hesab dike
- Bikaranîna formê hilbijêrin da ku hûn 50% bonusa spartinê daxwaz bikin