
ನಕಲು ವ್ಯಾಪಾರಕ್ಕಾಗಿ ಸೇವೆ. ನಮ್ಮ ಆಲ್ಗೋ ಸ್ವಯಂಚಾಲಿತವಾಗಿ ವಹಿವಾಟುಗಳನ್ನು ತೆರೆಯುತ್ತದೆ ಮತ್ತು ಮುಚ್ಚುತ್ತದೆ.
L2T ಆಲ್ಗೋ ಕಡಿಮೆ ಅಪಾಯದೊಂದಿಗೆ ಹೆಚ್ಚು ಲಾಭದಾಯಕ ಸಂಕೇತಗಳನ್ನು ಒದಗಿಸುತ್ತದೆ.
24/7 ಕ್ರಿಪ್ಟೋಕರೆನ್ಸಿ ವ್ಯಾಪಾರ. ನೀವು ನಿದ್ದೆ ಮಾಡುವಾಗ, ನಾವು ವ್ಯಾಪಾರ ಮಾಡುತ್ತೇವೆ.
ಗಣನೀಯ ಪ್ರಯೋಜನಗಳೊಂದಿಗೆ 10 ನಿಮಿಷಗಳ ಸೆಟಪ್. ಖರೀದಿಯೊಂದಿಗೆ ಕೈಪಿಡಿಯನ್ನು ಒದಗಿಸಲಾಗಿದೆ.
79% ಯಶಸ್ಸಿನ ಪ್ರಮಾಣ. ನಮ್ಮ ಫಲಿತಾಂಶಗಳು ನಿಮ್ಮನ್ನು ಪ್ರಚೋದಿಸುತ್ತವೆ.
ತಿಂಗಳಿಗೆ 70 ವಹಿವಾಟುಗಳವರೆಗೆ. 5 ಕ್ಕೂ ಹೆಚ್ಚು ಜೋಡಿಗಳು ಲಭ್ಯವಿದೆ.
ಮಾಸಿಕ ಚಂದಾದಾರಿಕೆಗಳು £58 ರಿಂದ ಪ್ರಾರಂಭವಾಗುತ್ತವೆ.
Bearish pressure may increase in S&P 500 market
S&P 500 ಬೆಲೆ ವಿಶ್ಲೇಷಣೆ - 20 ಡಿಸೆಂಬರ್
In case the momentum of the sellers increase, ಎಸ್ & ಪಿ 500 may break down the support level of $3740, and a further increase in sellers’ pressure may reduce the price to $3649 and $3493 levels. Should the support level of $3740 holds, the price can reverse and increase toward the resistance levels of $3926, $4087, and $4169.
ಪ್ರಮುಖ ಹಂತಗಳು:
ಪ್ರತಿರೋಧ ಮಟ್ಟಗಳು: $ 3926, $ 4087, $ 4169
ಬೆಂಬಲ ಮಟ್ಟಗಳು: $ 3740, $ 3649, $ 3493
S&P 500 ದೀರ್ಘಾವಧಿಯ ಪ್ರವೃತ್ತಿ: ಬೇರಿಶ್
S&P 500 is bearish on the daily chart. The bulls could not maintain their momentum when the price reached the resistance level of $4087. A small double-top chart pattern formed at the mentioned level; is an indication that sellers are ready to dominate the market. The sellers’ pressure increased and the price penetrated the support level of $3926. It is currently targeting the support level of $3740.
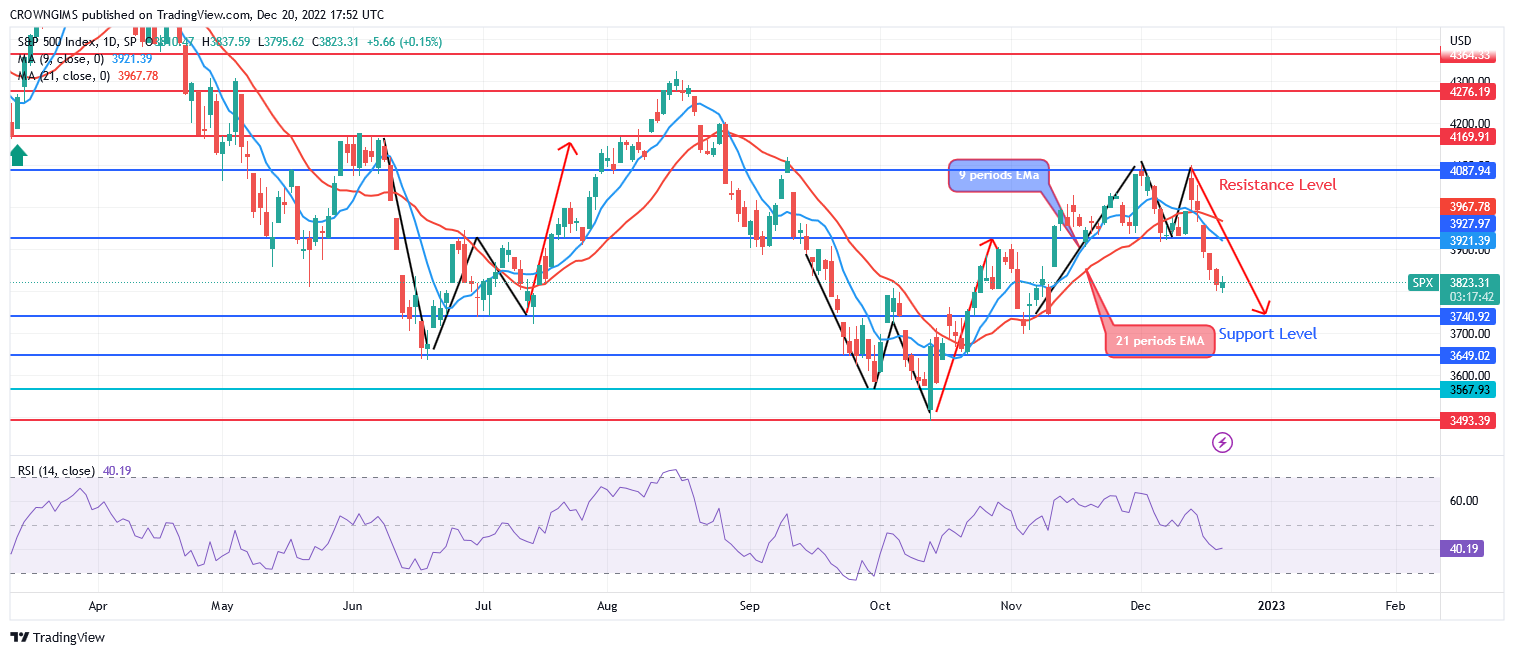
S&P 500 is trading below the 9-periods EMA and the 21-period EMA which indicates bearish momentum. In case the momentum of the sellers increase, S&P 500 may break down the support level of $3740, and a further increase in sellers’ pressure may reduce the price to $3649 and $3493 levels. Should the support level of $3740 holds, the price can reverse and increase toward the resistance levels of $3926, $4087 and $4169. The relative strength index period 14 is at 40 levels with the signal line pointing down to indicate a sell signal.
S&P 500 ಮಧ್ಯಮ-ಅವಧಿಯ ಪ್ರವೃತ್ತಿ: ಬೇರಿಶ್
S&P 500 is on a bearish movement in the 4-hour chart outlook. The price action formed an “M” chart pattern in the 4-hour time frame. The price increased to the resistance level of $4087. It pulled back to retest the support level of $3937, the just mentioned level holds. The price is obeying the command from the bearish chart pattern formed. 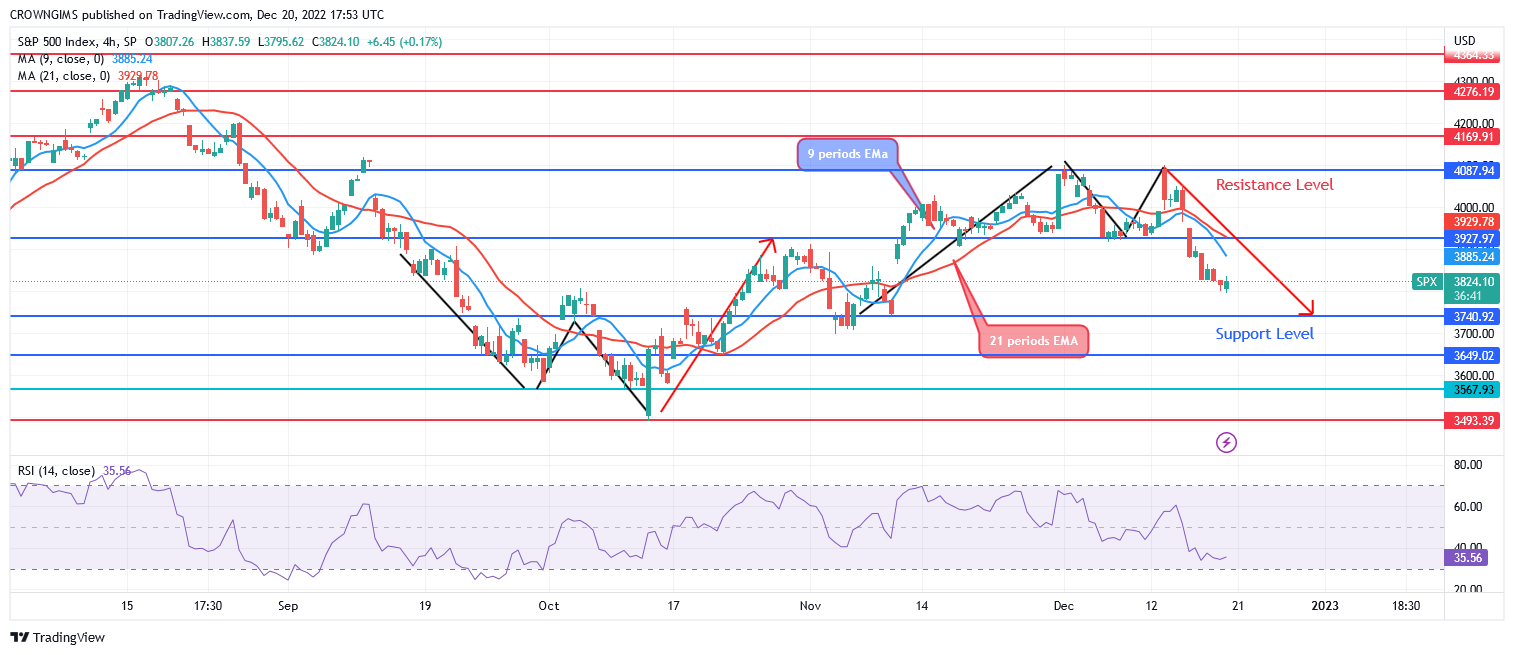
The price is trading below the 9-periods EMA and 21-periods EMA as an indication of bearish movement. The relative strength index period 14 is at 35 levels displaying a bearish signal.
ನೀವು ಲಕ್ಕಿ ಬ್ಲಾಕ್ ಅನ್ನು ಇಲ್ಲಿ ಖರೀದಿಸಬಹುದು. LBLOCK ಅನ್ನು ಖರೀದಿಸಿ
- ಬ್ರೋಕರ್
- ಕನಿಷ್ಠ ಠೇವಣಿ
- ಸ್ಕೋರ್
- ಬ್ರೋಕರ್ಗೆ ಭೇಟಿ ನೀಡಿ

- ಪ್ರಶಸ್ತಿ ವಿಜೇತ ಕ್ರಿಪ್ಟೋಕರೆನ್ಸಿ ವ್ಯಾಪಾರ ವೇದಿಕೆ
- Minimum 100 ಕನಿಷ್ಠ ಠೇವಣಿ,
- ಎಫ್ಸಿಎ ಮತ್ತು ಸೈಸೆಕ್ ನಿಯಂತ್ರಿಸಲಾಗಿದೆ

- % 20 ವರೆಗೆ 10,000% ಸ್ವಾಗತ ಬೋನಸ್
- ಕನಿಷ್ಠ ಠೇವಣಿ $ 100
- ಬೋನಸ್ ಜಮೆಯಾಗುವ ಮೊದಲು ನಿಮ್ಮ ಖಾತೆಯನ್ನು ಪರಿಶೀಲಿಸಿ

- 100 ಕ್ಕೂ ಹೆಚ್ಚು ವಿಭಿನ್ನ ಹಣಕಾಸು ಉತ್ಪನ್ನಗಳು
- $ 10 ರಿಂದ ಹೂಡಿಕೆ ಮಾಡಿ
- ಒಂದೇ ದಿನದ ವಾಪಸಾತಿ ಸಾಧ್ಯ
- ಫಂಡ್ ಮೊನೆಟಾ ಮಾರ್ಕೆಟ್ಸ್ ಖಾತೆ ಕನಿಷ್ಠ $ 250
- ನಿಮ್ಮ 50% ಠೇವಣಿ ಬೋನಸ್ ಪಡೆಯಲು ಕ್ಲೈಮ್ ಅನ್ನು ಆಯ್ಕೆ ಮಾಡಿಕೊಳ್ಳಿ