
市場分析 – 27 月 XNUMX 日
NZDUSD has recently broken out of a consolidation phase, signalling a shift towards a bearish trajectory. Previously confined within a narrow trading range, indicative of market indecision, NZDUSD’s recent breakout hints at a downward bias.
NZDUSDキーレベル
デマンドゾーン:0.63300、0.58640
供給ゾーン:0.62120、0.63750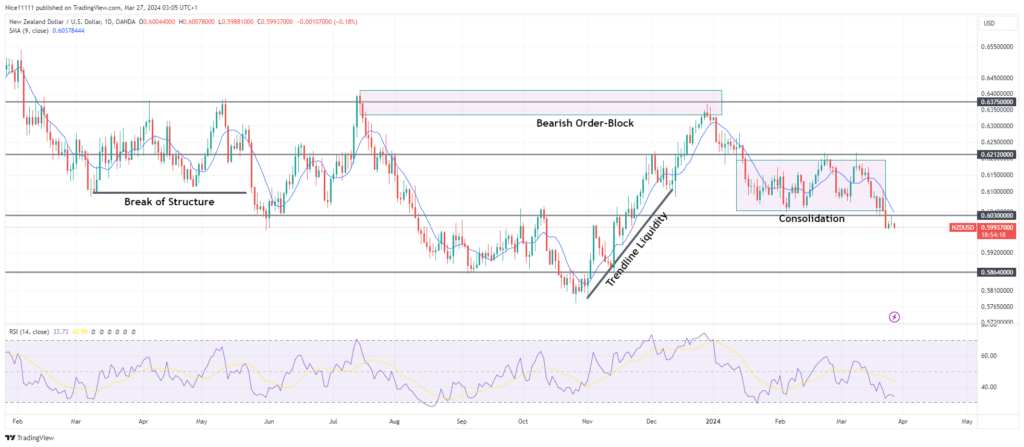
NZDUSD長期トレンド:弱気
NZDUSD initiated a downward 傾向 in mid-August 2023, marked by a bearish break in market structure. Following a rebound from the 0.58640 level in November, the price surged to 0.63750. The ascent helped the price retest the bearish order block, which initiated the bearish trend. However, a subsequent decline ensued as bears capitalized on the sell-off. The market then entered a ranging phase, oscillating between the 0.60300 and 0.62120 support levels.
Notably, the Moving Average period nine underscored the price rigidity throughout February and March. The Moving Averange rested within the range, on the bodies of the daily candles paddling back and forth the range. The bearish breakout from this range suggests a resurgence of bearish momentum targeting trendline liquidity, notably clustered with previous lows. Confirming this bearish trajectory, the Moving Average remains above the price mark. The price has been closing consistently below the Moving Average 周期 nine on the daily chart.

NZDUSD短期トレンド:弱気
Examining the 4-hour timeframe reveals a recent bearish structural break, aligning with the daily bias. However, the 4-hour Relative Strength Index indicates an oversold condition, implying a potential for a corrective 撤退.
Notably, the market retraced to the previous support level at 0.60300, now acting as resistance. This retest offers the sellers a strategic point to capitalize on the prevailing downward trend. The retest is also expected to fuel selling pressure for a decline in the price. Anticipated targets aim to exploit trendline liquidity for prevailing 外為信号, with an ultimate objective below 0.58640.
取引を次のレベルに引き上げたいですか? そのための最適なプラットフォームに参加する
- ブローカー
- 最低預金
- スコア
- ブローカーにアクセス


