NZDUSDキーレベルで過剰に拡張
主なレジスタンス: 0.7460 主なサポート: 0.7360 – 0.7340 -0.7287 長期的な見方 NZD/USD は 2020 年 36.20 月の安値以来、大規模な強気相場にあり、1979% または 2018 ピップス上昇しました。 私たちは今や市長の重要なレベルに達しました。 NUがこれらのレベルで最後に取引されたのはXNUMX年XNUMX月であり、[…]
主なレジスタンス: 0.7460 主なサポート: 0.7360 – 0.7340 -0.7287 長期的な見方 NZD/USD は 2020 年 36.20 月の安値以来、大規模な強気相場にあり、1979% または 2018 ピップス上昇しました。 私たちは今や市長の重要なレベルに達しました。 NUがこれらのレベルで最後に取引されたのはXNUMX年XNUMX月であり、[…]
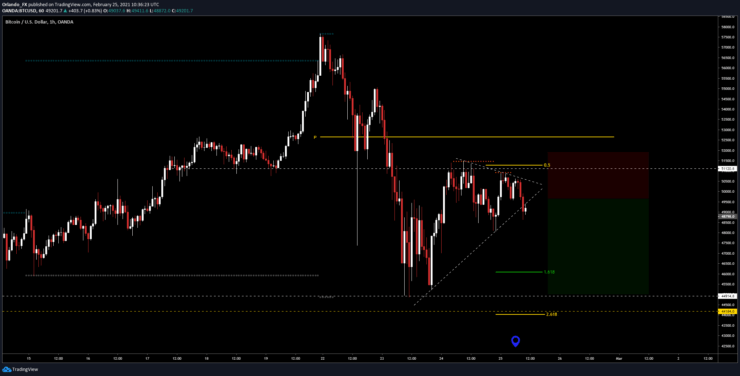
キーレジスタンス51500– 5300キーサポート:44900 – 44000長期ビュービットコインは購入資産であり、しばらく前から存在しています。 それに対するスイングトレードは、過去に数人の大金マネージャーにとってひどく間違っていました。 しかし、私たちはトレーダーなので、これは下振れから利益を得ることができないという意味ではありません[…]
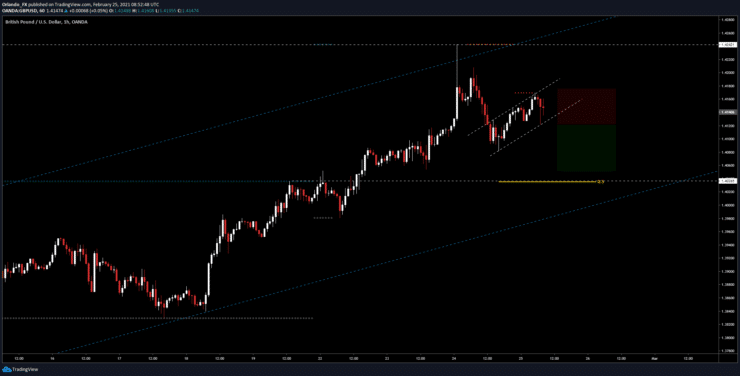
キーレジスタンス:1.4170 – 1.4220キーサポート:1.4080 – 1.4037長期的展望GUは、2020年25月にほぼ+ 1%の動きで、非常に力強い上昇傾向にあります。 この強気の動きの最新の足は過度に拡張されています。 GUの165Hチャート分析価格は昨日高値からXNUMXピップス下落しました[…]
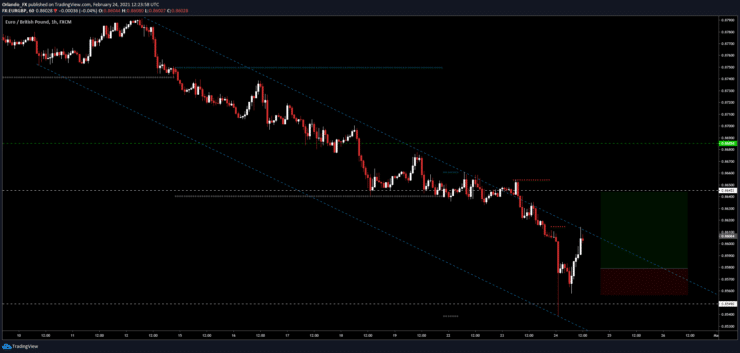
キーサポート:0.8549キーレジスタンス:0.8640長期ビューEURGBPは8.25年9月2020日の高値から1%下落しました。これは非常に不安定な方法です。 この市場は構造に欠けていますが、主要なレベルは非常に尊重されています。 0.8550Hチャート分析EUR / GBPは、複数年レベルのサポート(XNUMX)を拒否し、購入の設定を行いました[…]
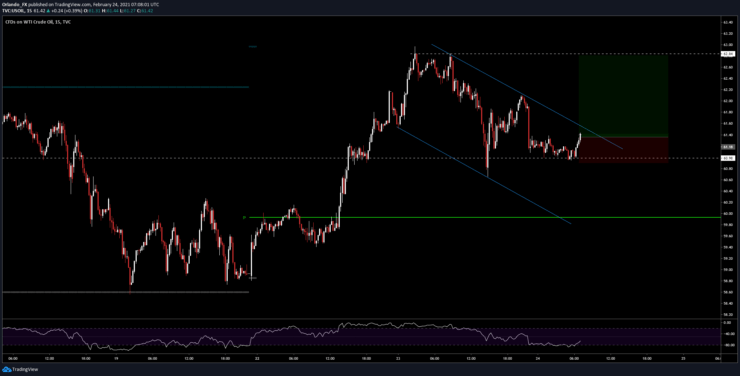
Key Support: 61.00 – 60.65 Key Resistance: 62.00 – 62.85 Long Term View After negative crude prices back in April 2020, price in WTI has rallied more than 1,000% and is now rejecting a previous low for a possible continuation. Historic Negative Prices Prices in $CL (crude futures) went negative in April 2020 because of […]
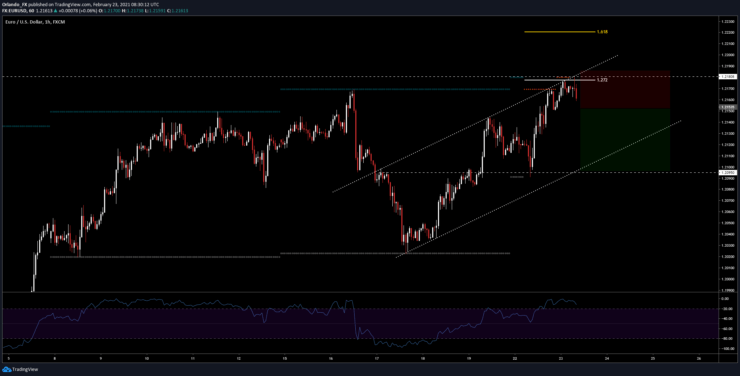
Key Resistance Level: 1.2180 Key Support Levels: 1.2150 – 1.21 Mid-Term View The EUR/USD has rallied to a big level. Last time it tested and rejected it, price moved down 230 pips (-1.88%). It´s important to see the confluence here (key resistance + short term bullish structure test + short term bullish targets + DXY […]
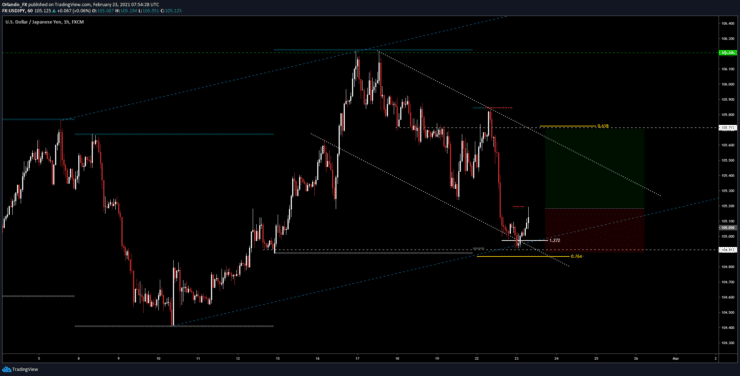
Key Support Levels: 104.90 Key Resistance Levels: 105.40 – 105.70 – 106.20 Long Term View The USD/JPY is trading inside a mid term bullish structure and has now retraced back 76.4% of the entire bullish move to retest the structure and the previous weekly lows having hit short term bearish targets in confluence. Long term […]
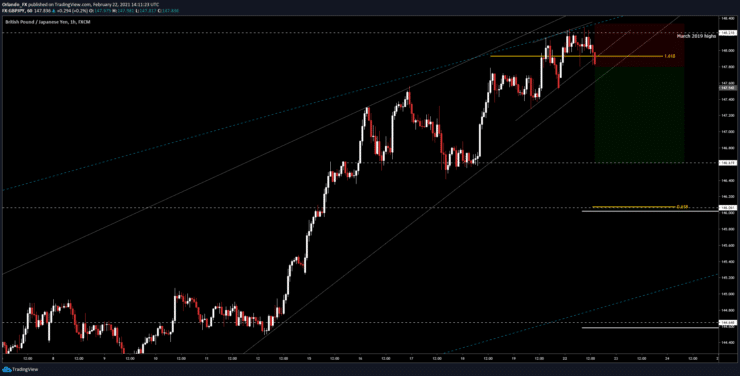
Key Support: 147.45 – 146.60 Key Resistance: 148.25 Long Term View The GJ has been in a super strong bullish momentum, up 8.30% since the December 11th lows without a real pullback. The biggest pullback was 1.4%back in Jan. 14-18. 1H Chart Analysis The March 2019 highs that are being retested at the moment brought […]
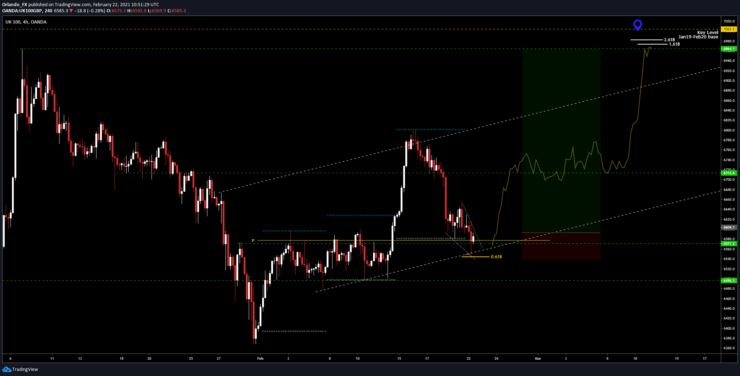
Key Support: 6560 – 6495 Key Resistance: 6710 – 6800 – 6900 Long Term View The FTSE opened and dip to retest the previous key level, monthly pivot and bullish structure. This rejection is key to our long idea. 4H Analysis The previous key level around the 6570 was the level capping the upside in […]