
Ọrụ maka ịzụ ahịa nnomi. Algo anyị na-emepe ma mechie azụmaahịa na-akpaghị aka.
L2T Algo na-enye akara ngosi bara uru nke ukwuu na obere ihe egwu.
24/7 ahia cryptocurrency. Mgbe ị na-ehi ụra, anyị na-azụ ahịa.
Nhazi nkeji 10 nwere nnukwu uru. Enyere akwụkwọ ntuziaka na ịzụrụ.
Ọnụego ịga nke ọma 79%. Nsonaazụ anyị ga-atọ gị ụtọ.
Ruo azụmaahịa 70 kwa ọnwa. Enwere ihe karịrị ụzọ abụọ ise dị.
Ndebanye aha kwa ọnwa na-amalite na £58.
Amụma ọnụ ahịa ọnụọgụ: Disemba 23
The Kedu price forecast is that the market will complete a bullish reversal towards the resistance level. This is anticipated, as the market has already shown reversal chart patterns.
Usoro Ogologo Ogologo Quant: Bullish (Chatịnụ otu ụbọchị)
Etoju Isi:
Mpaghara ọkọnọ: $111.00, $155.70, $222.70
Mpaghara achọrọ: $42.40, $88.70, $101.30
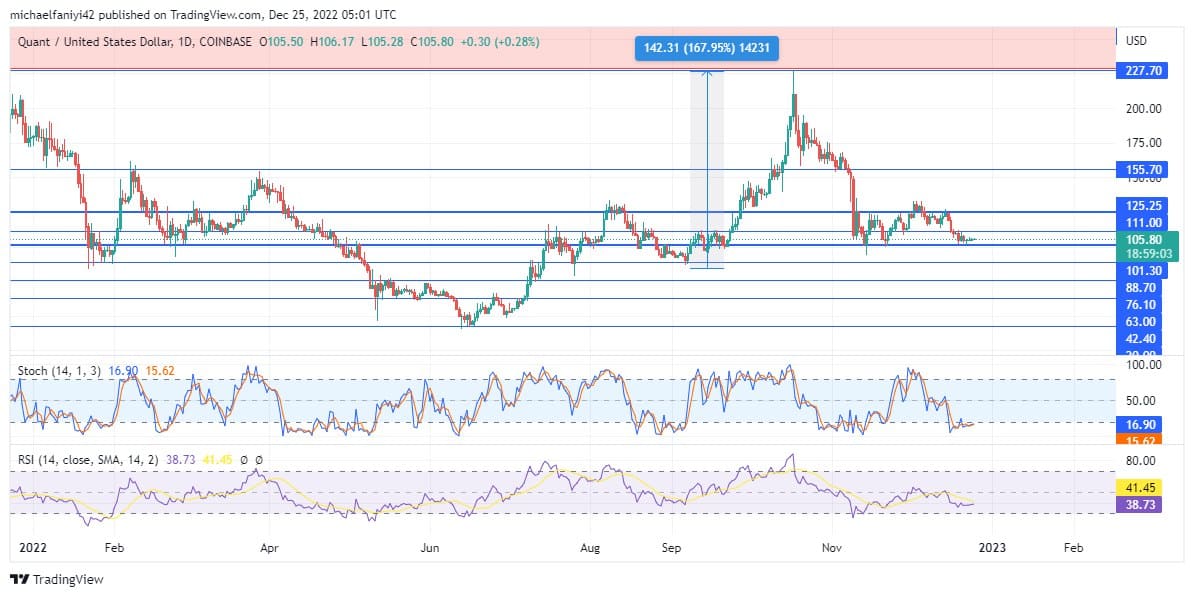
The Kedu market remains structured for an upward movement but is, however, caught up in consolidation between the $125.25 resistance level and the $101.30 demand level. Currently, the price has routinely dropped to the support level, and it is due for another price rise. Buyers will look to capitalize on this by driving the coin aggressively out of consolidation and toward the previous resistance level of $227.70.
Quant amụma amụma: QNT/USD Outlook
The general structure of the Quant market still predisposes it to an upward movement despite its current hitch. Since dropping from the $227.70 resistance level, the price has been confined to consolidation.
Despite being in consolidation, the bulls still want more. They even breached the supply level at the beginning of the month, but they weren’t able to hold above it.
The coin has now dropped to the support level and is already showing the spinning top and Doji candlesticks, which are reversal candlesticks. The Stochastic lines are about to rise from the oversold region.
Usoro Ọkara QNT/USD: Bullish (Chatịnụ awa 4)
Still, on the daily chart, the RSI (Relative Strength Index) line has stopped dipping and is now moving more laterally in readiness to begin an upward move. On the 4-hour chart, the RSI line has bounced up to the middle line, where it pulls back a little before continuing its upward mobility.
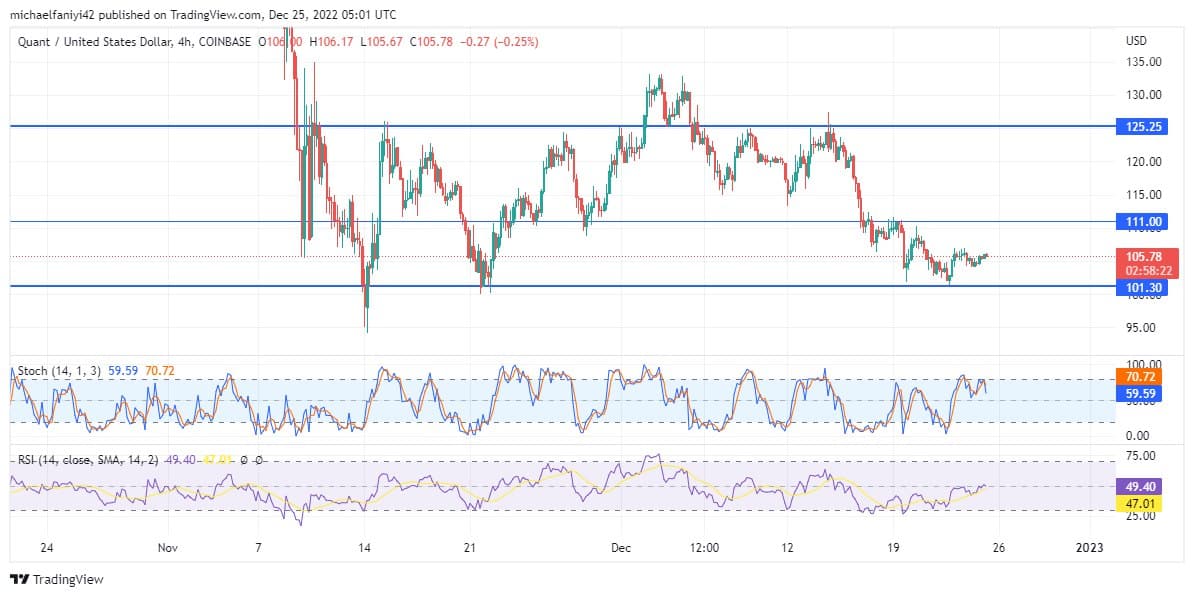
The movement of the Stochastic Oscillator lines on the 4-hour chart is similar to that of the RSI in that it has bounced upward to the border of the overbought region, where the line is now pulling back before another upward surge. The buyers are expected to fully exploit their turn to drive the market up and will be looking to break the $125.25 supply level in the process.
Ebe mmeri Quant trades na anyị. Nweta QNT ebe a
Note: Muta2ihe abughi onye ndumodu ego. Mee nchọnchọ tupu itinye ego gị na aka akụ ọ bụla ma ọ bụ gosipụtara ngwaahịa ma ọ bụ ihe omume. Anyị ebughi ọrụ maka nsonaazụ itinye ego gị.
- Broker
- Min ego
- Akara
- Nleta Broker

- Onyinye-emeri Cryptocurrency trading n'elu ikpo okwu
- $ 100 nkwụnye ego kacha nta,
- FCA & Cysec chịkwara

- 20% nabata ego nke ihe ruru $ 10,000
- Obere nkwụnye ego $ 100
- Nyochaa akaụntụ gị tupu daashi na-otoro

- N'ime 100 ngwaahịa ego dị iche iche
- Tinye ego na $ 10
- Withdrawalwepu otu ụbọchị ga-ekwe omume
- Ahịa Moneta Ahịa nwere akaụntụ opekata mpe $ 250
- Banye iji mpempe akwụkwọ iji kwuo ego nkwụnye ego 50% gị