
Sèvis pou komès kopi. Algo nou an otomatikman louvri epi fèmen echanj.
L2T Algo bay siyal trè pwofitab ak risk minim.
Komès kriptografik 24/7. Pandan w ap dòmi, nou fè komès.
10 minit konfigirasyon ak avantaj sibstansyèl. Manyèl la bay ak acha a.
79% Pousantaj siksè. Rezilta nou yo pral eksite ou.
Jiska 70 echanj pa mwa. Gen plis pase 5 pè ki disponib.
Abònman chak mwa kòmanse nan £ 58.
Vandè yo ap domine mache AUDUSD
Analiz Pri AUDUSD - 02 Novanm
When sellers gain more momentum, the support level of $0.63 may be broken downside and price may decrease to the support level of $0.62, and $0.61. In case buyers oppose sellers at $0.63 level, AUDUSD may reverse and face the resistance direction at $0.65, $0.66 and $0.68 levels.
Mache AUD/USD
Nivo kle yo:
Nivo rezistans: $ 0.65, $ 0.66, $ 0.68
Nivo sipò yo: $ 0.63, $ 0.62, $ 0.61
AUDUSD Tandans alontèm: Bullish
AUDUSD is bullish on the daily chart. Buyers took over the market when it tested the support level of $0.61. The buyers’ momentum continue to increase in the AUDUSD market as a candle pattern called marubozu formed. More bullish candles are produced and the price moves up. The former resistance level of $0.63 has turned to support level. Price pulled back when it tested the $0.65 resistance level.
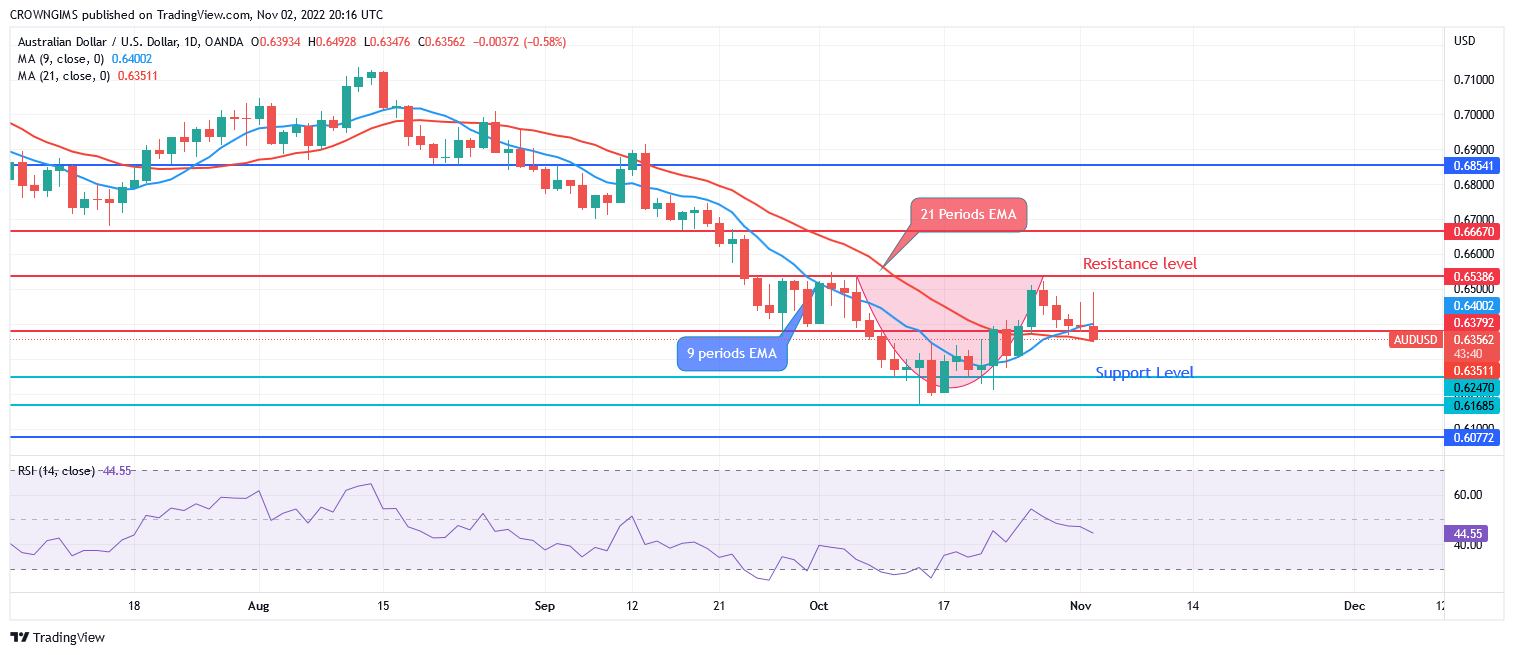
AUDUSD continue trading above the 9 periods EMA and 21 periods EMA which indicate that buyers’ momentum is increasing. The relative strength index period 14 is at 48 levels and the signal lines pointing upside displaying bullish direction. When sellers gain more momentum, the support level of $0.63 may be broken downside and price may decrease to the support level of $0.62, and $0.61. In case buyers oppose sellers at $0.63 level, price may reverse and face the resistance direction at $0.65, $0.66 and $0.68 levels.
Tandans a mwayen tèm AUDUSD: Bearish
AUDUSD is bearish on the 4-hour chart. The price action has formed a “cup with handle” chart pattern. The bears are taken over the market for the formation of handle. The support level of $0.63 is tested.
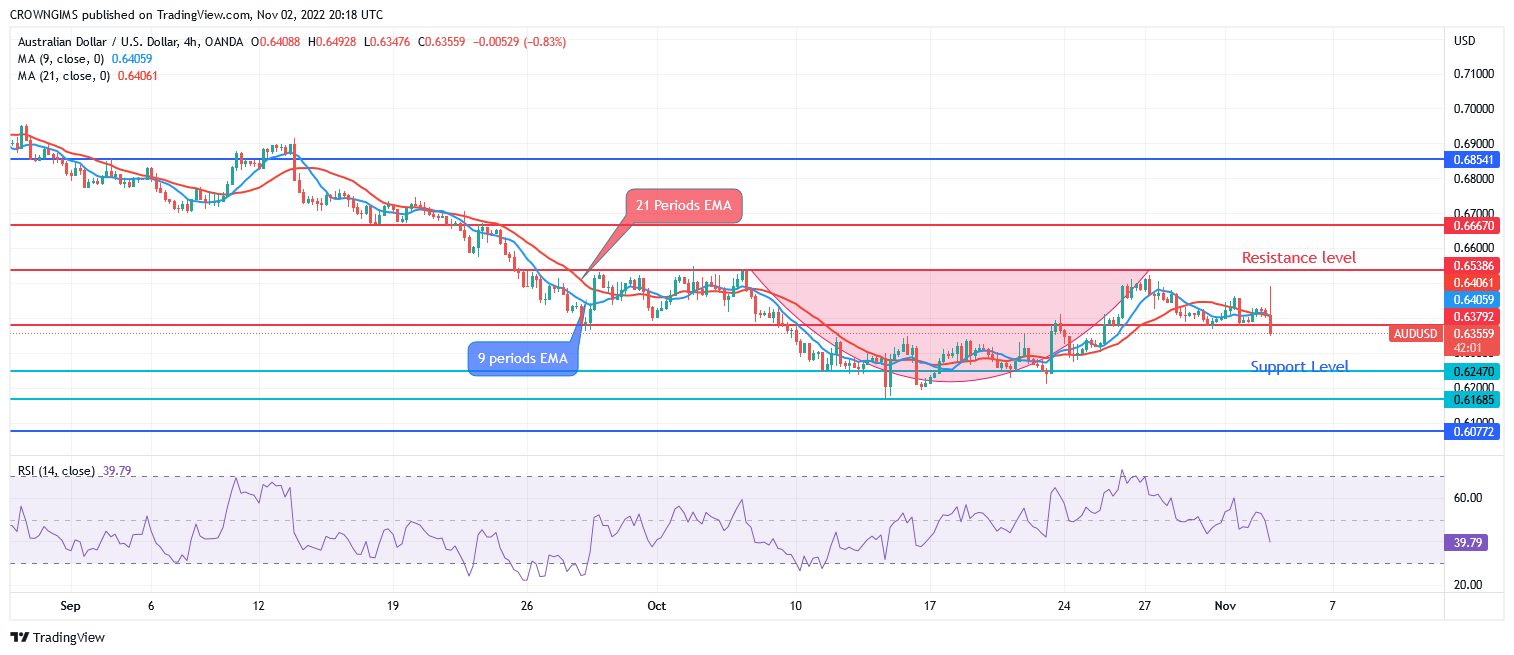
AUDUSD is currently trading around the 9 periods EMA and 21 periods EMA at close contact, which indicate low bearish and low bullish momentum. The relative strength index period 14 is at 49 levels with the signal lines pointing down to indicate a sell signal.
Ou ka achte Lucky Block isit la. Achte LBLOCK
- Fè
- Min depo
- Nòt
- Vizite Fè

- Prim-genyen platfòm komès Cryptocurrency
- $ 100 depo minimòm,
- FCA & Cysec reglemante

- 20% bonis akeyi jiska $ 10,000
- Depo minimòm $ 100
- Verifye kont ou anvan yo bonis la kredite yo

- Plis pase 100 diferan pwodwi finansye
- Envesti nan ti kòm $ 10
- Retrè menm jou a posib
- Fon Moneta Mache kont ak yon minimòm de $ 250
- Opt nan lè l sèvi avèk fòm nan reklamasyon 50% bonis depo ou