
Kev pabcuam luam tawm. Peb Algo cia li qhib thiab kaw kev lag luam.
L2T Algo muab cov txiaj ntsig tau zoo heev nrog kev pheej hmoo tsawg.
24/7 cryptocurrency trading. Thaum koj pw, peb pauv.
10 feeb teeb nrog ntau qhov zoo. Phau ntawv yog muab nrog kev yuav khoom.
79% Kev vam meej. Peb cov txiaj ntsig yuav zoo siab rau koj.
Txog li 70 kev lag luam hauv ib hlis. Muaj ntau tshaj 5 khub muaj.
Kev tso npe txhua hli pib ntawm £ 58.
Price may further increase in S&P 500 market
S&P 500 Nqe Kev Ntsuam Xyuas - 13 Lub Kaum Ob Hlis
When the momentum of the buyers increases, S&P 500 may break up the resistance level of $4087, and further increase envisaged towards $4169 and $4276 levels. The support level of $3937 can be penetrated if sellers increase their pressure, then, support level of $3740, and $3640 may be tested. The relative strength index period 14 is at 56 levels with the signal lines pointing up to indicate buy signal.
Theem theem:
Theem qib: $ 4087, $ 4169, $ 4276
Cov nyiaj them yug theem: $ 3937, $ 3740, $ 3649
S&P 500 Lub Sijhawm Ntev: Bullish
S&P 500 is bullish on the daily chart. The bulls maintain their position in the S&P 500 market but there was low volatility in the S&P 500 last week. S&P 500 continues trading within the resistance level of $4087 and support level of $3937. The bulls are yet to gain enough pressure to break up the mentioned resistance level. Likewise, the bears made an attempt to break down the support level of $3937 but the bulls defended the mentioned level. At the moment, the price is trading with the $ 3937 and $4087 levels.
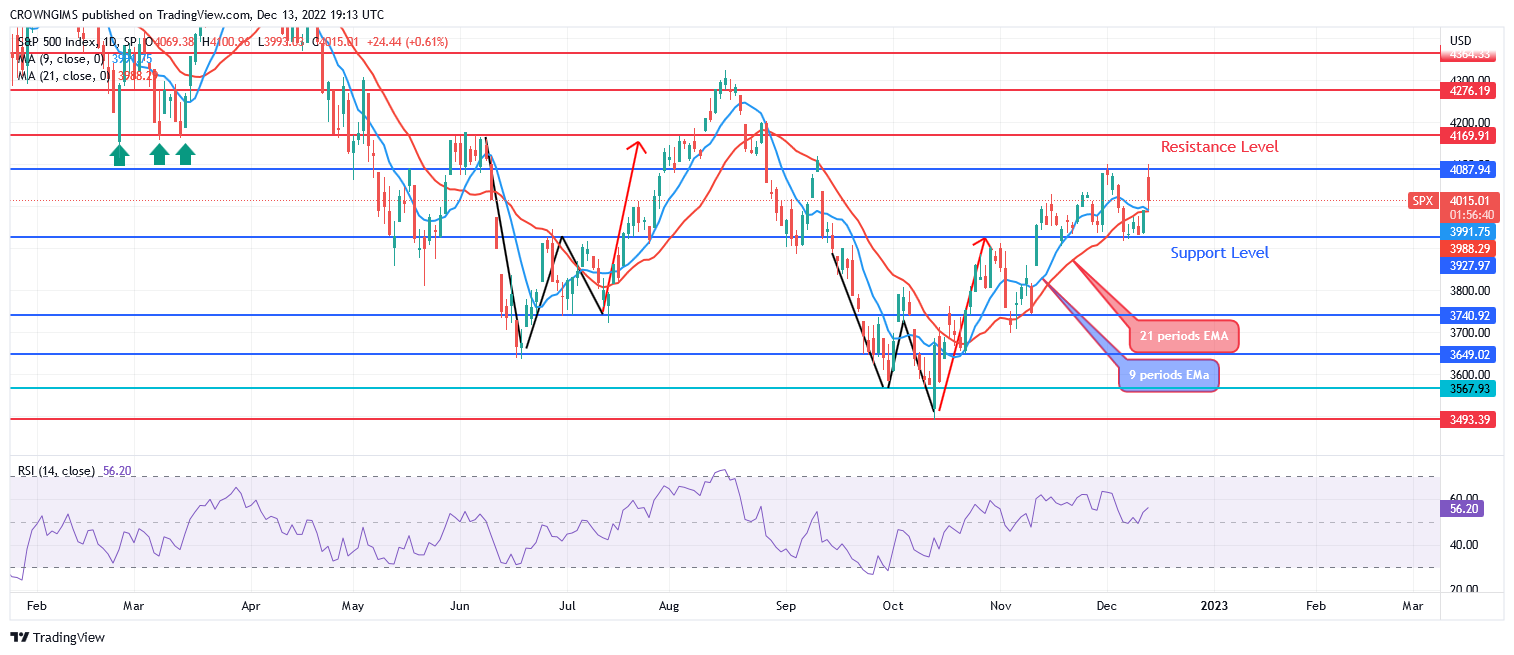
S&P 500 is trading slightly above the 9-periods EMA and the 21-period EMA which indicate a bullish momentum. When the momentum of the buyers increases, S&P 500 may break up the resistance level of $4087, and a further increase is envisaged towards $4169 and $4276 levels. The support level of $3937 can be penetrated if sellers increase their pressure, then, a support level of $3740, and $3640 may be tested. The relative strength index period 14 is at 56 levels with the signal lines pointing up to indicate a buy signal.
S&P 500 Lub Sijhawm Nruab Nrab Nruab Nrab: Bullish
S&P 500 is on a bullish movement in the 4-hour chart outlook. Last two weeks, the price increased to the resistance level of $4087. It pulled back to retest the support level of $3937, the just mentioned level holds. There was a short period of consolidation at the $3937 level. Last week, the price increased again and the resistance level of $4087 was retested.
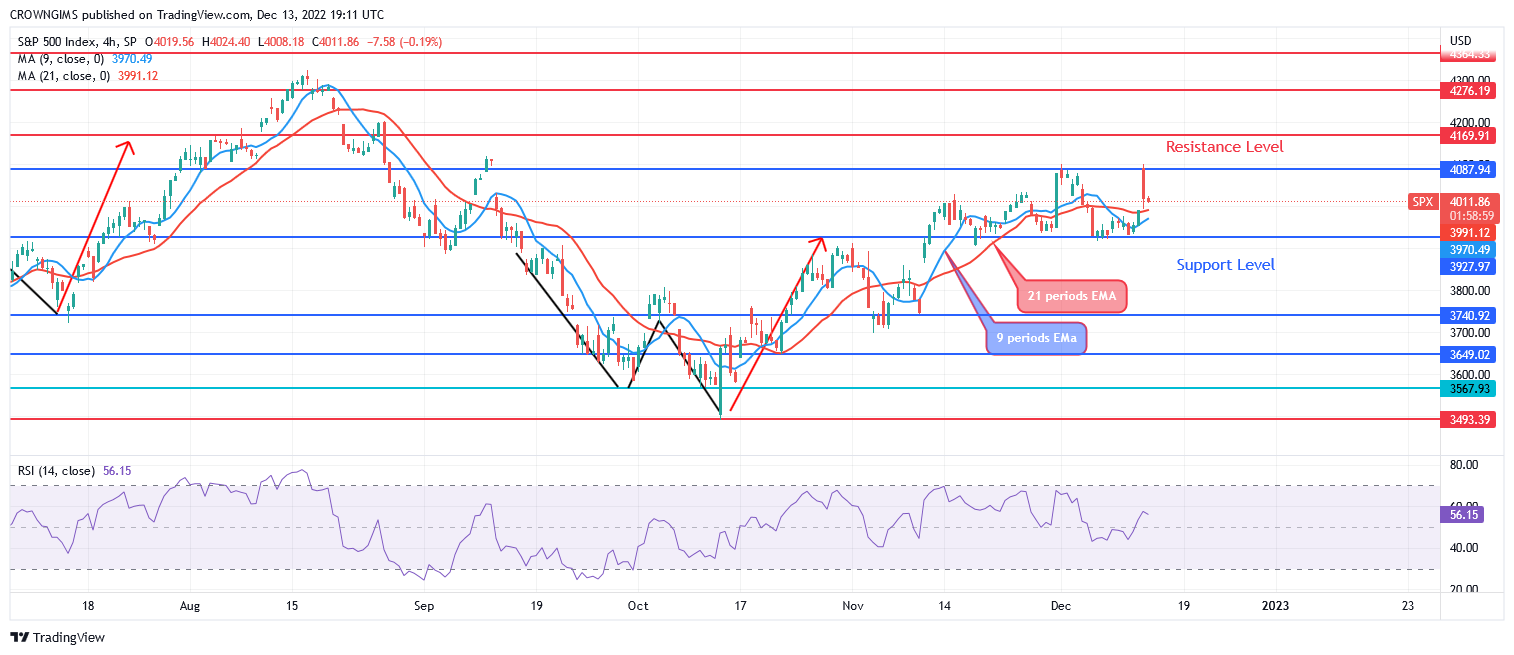
Tus nqi yog trading saum 9-periods EMA thiab 21-periods EMA raws li ib qho kev qhia ntawm bullish zog. Tus txheeb ze lub zog Performance index lub sij hawm 14 yog nyob rau ntawm 57 theem qhia ib tug bullish teeb liab.
Koj tuaj yeem yuav Lucky Block ntawm no. Yuav LBLOCK
- broker
- Min Tso nyiaj
- Score
- Mus ntsib Broker

- Cov puav pheej yeej Cryptocurrency trading platform
- Them $ 100 qhov tsawg kawg nkaus,
- FCA & Cysec yog kev tswj hwm

- 20% txais tos lawm ntawm upto $ 10,000
- Qhov tsawg kawg nkaus tso $ 100
- Xyuas koj tus lej nyiaj uantej cov nyiaj yuav suav tau

- Hla 100 txawv cov khoom lag luam nyiaj txiag
- Nqes los ntawm me ntsis li $ 10
- Kev tshem tawm tib hnub yog ua tau
- Kev Nqis Tus Nqi Nqis Tshaj
- 50% Zoo Siab Txais Tos
- Kev yeej-yeej 24 Teev Kev Pab Txhawb
- Fund Moneta Markets account nrog yam tsawg kawg ntawm $ 250
- Xaiv siv daim foos los thov koj qhov nyiaj 50% tso nyiaj ntxiv