Kev pabcuam luam tawm. Peb Algo cia li qhib thiab kaw kev lag luam.
L2T Algo muab cov txiaj ntsig tau zoo heev nrog kev pheej hmoo tsawg.
24/7 cryptocurrency trading. Thaum koj pw, peb pauv.
10 feeb teeb nrog ntau qhov zoo. Phau ntawv yog muab nrog kev yuav khoom.
79% Kev vam meej. Peb cov txiaj ntsig yuav zoo siab rau koj.
Txog li 70 kev lag luam hauv ib hlis. Muaj ntau tshaj 5 khub muaj.
Kev tso npe txhua hli pib ntawm £ 58.
Forex trading can be as difficult or as easy as you want it to be. Indicators and strategies can make trading much easier. Being able to read and understand forex price action is one of the most useful ways to trade currencies.
Price action analysis was first introduced by Charles Dow, who laid the foundations for modern technical analysis. Since inception, it has been developed and advanced remarkably. Understanding price action gives you that extra edge you need to get over the profit line. That’s one reason more and more currency traders are interested in using a forex price action strategy as one of their main tools for crafting trading decisions.
4
Them kev
Trading platforms
Tswj los ntawm
Kev Pab
Min. Deposit
Leverage max
txiaj officers
Classification
mobile App
Rating
Tus nqi tag nrho
$ 0
![]() Commission
3.5
Commission
3.5
Min. Deposit
$100
Tshaj tawm min.
Variables pib
Leverage max
100
txiaj officers
40
Trading platforms
Kev Siv Nyiaj


Tswj los ntawm
FCA
Qhov koj tuaj yeem pauv tau
Forex
indices
kev nqis tes ua
Cryptocurrencies
Cov Khoom Raw
Nruab nrab kis
EUR / GBP
-
EUR / USD
-
EUR / JPY
0.3
EUR / CHF
0.2
GBP / USD
0.0
GBP / JPY
0.1
GBP / CHF
0.3
USD / JPY
0.0
USD / CHF
0.2
CHF / JPY
0.3
Tus nqi ntxiv
Tus nqi tsis tu ncua
ntau yam
Hloov Siab
Variables pib
tswj
Yog
FCA
Tsis yog
CYSEC
Tsis yog
ASIC
Tsis yog
CFTC
Tsis yog
NFA
Tsis yog
BAFIN
Tsis yog
CMA
Tsis yog
SCB
Tsis yog
DFSA
Tsis yog
CBFSAI
Tsis yog
BVIFSC
Tsis yog
FSCA
Tsis yog
FSA
Tsis yog
FFAJ
Tsis yog
ADGM
Tsis yog
FRSA
71% ntawm cov khw muag khoom poob peev nyiaj poob thaum ua lag luam CFDs nrog tus muab kev pabcuam no.
Rating
Tus nqi tag nrho
$ 0
![]() Commission
0
Commission
0
Min. Deposit
$100
Tshaj tawm min.
- pib
Leverage max
400
txiaj officers
50
Trading platforms
Kev Siv Nyiaj
Tswj los ntawm
CYSECASICCBFSAIBVIFSCFSCAFSAFFAJADGMFRSA
Qhov koj tuaj yeem pauv tau
Forex
indices
kev nqis tes ua
Cryptocurrencies
Cov Khoom Raw
Etfs
Nruab nrab kis
EUR / GBP
1
EUR / USD
0.9
EUR / JPY
1
EUR / CHF
1
GBP / USD
1
GBP / JPY
1
GBP / CHF
1
USD / JPY
1
USD / CHF
1
CHF / JPY
1
Tus nqi ntxiv
Tus nqi tsis tu ncua
-
Hloov Siab
- pib
tswj
Tsis yog
FCA
Yog
CYSEC
Yog
ASIC
Tsis yog
CFTC
Tsis yog
NFA
Tsis yog
BAFIN
Tsis yog
CMA
Tsis yog
SCB
Tsis yog
DFSA
Yog
CBFSAI
Yog
BVIFSC
Yog
FSCA
Yog
FSA
Yog
FFAJ
Yog
ADGM
Yog
FRSA
71% ntawm cov khw muag khoom poob peev nyiaj poob thaum ua lag luam CFDs nrog tus muab kev pabcuam no.

Rating
Tus nqi tag nrho
$ 0
![]() Commission
6.00
Commission
6.00
Min. Deposit
$10
Tshaj tawm min.
- pib
Leverage max
10
txiaj officers
60
Trading platforms
Kev Siv Nyiaj
Qhov koj tuaj yeem pauv tau
Forex
indices
Cryptocurrencies
Nruab nrab kis
EUR / GBP
1
EUR / USD
1
EUR / JPY
1
EUR / CHF
1
GBP / USD
1
GBP / JPY
1
GBP / CHF
1
USD / JPY
1
USD / CHF
1
CHF / JPY
1
Tus nqi ntxiv
Tus nqi tsis tu ncua
-
Hloov Siab
- pib
tswj
Tsis yog
FCA
Tsis yog
CYSEC
Tsis yog
ASIC
Tsis yog
CFTC
Tsis yog
NFA
Tsis yog
BAFIN
Tsis yog
CMA
Tsis yog
SCB
Tsis yog
DFSA
Tsis yog
CBFSAI
Tsis yog
BVIFSC
Tsis yog
FSCA
Tsis yog
FSA
Tsis yog
FFAJ
Tsis yog
ADGM
Tsis yog
FRSA
Koj lub peev yog qhov pheej hmoo.
Rating
Tus nqi tag nrho
$ 0
![]() Commission
0.1
Commission
0.1
Min. Deposit
$50
Tshaj tawm min.
- pib
Leverage max
500
txiaj officers
40
Trading platforms
Kev Siv Nyiaj
Qhov koj tuaj yeem pauv tau
Forex
indices
kev nqis tes ua
Cov Khoom Raw
Nruab nrab kis
EUR / GBP
-
EUR / USD
-
EUR / JPY
-
EUR / CHF
-
GBP / USD
-
GBP / JPY
-
GBP / CHF
-
USD / JPY
-
USD / CHF
-
CHF / JPY
-
Tus nqi ntxiv
Tus nqi tsis tu ncua
-
Hloov Siab
- pib
tswj
Tsis yog
FCA
Tsis yog
CYSEC
Tsis yog
ASIC
Tsis yog
CFTC
Tsis yog
NFA
Tsis yog
BAFIN
Tsis yog
CMA
Tsis yog
SCB
Tsis yog
DFSA
Tsis yog
CBFSAI
Tsis yog
BVIFSC
Tsis yog
FSCA
Tsis yog
FSA
Tsis yog
FFAJ
Tsis yog
ADGM
Tsis yog
FRSA
71% ntawm cov khw muag khoom poob peev nyiaj poob thaum ua lag luam CFDs nrog tus muab kev pabcuam no.
Since price action trading doesn´t predict the future like many other indicators, it never lies; it will tell you how the market will behave during different time frames and periods of volatility.

The Price Is Always Right – It Never Lies
What Is Price Action?
Price action is the fluctuation in the price of a financial instrument, be it stocks, commodities or currencies. In order to predict future price movements, it is necessary to observe pricing fluctuations for quite some time. This is an integral part of understanding how price reacts to economic events or certain technical levels.
To an inexperienced currency trader, the movement of forex price action might look chaotic. Different people interpret it in unique ways, with many considering finding a productive forex price action strategy to be an elusive task. Nonetheless, price action can be read easily through the basic tools of technical analysis. Candlestick formations, retrace strength, wide range candles, engulfing patterns, dojis, pins, and narrow range candles are only a few examples of periodic price action barometers.
Price action trading means that you read/analyze past or present price behavior in order to build a trading plan for the future. The strategies based on price action analysis can be divided into two groups:
- Strategies where you have to observe the price fluctuation continuously in order to identify a market entry/exit point
- Strategies where you have to look at the past price movement on a chart and quantify a pending order
Each way is useful in building a valid forex price action strategy.
Constructing A Forex Price Action Strategy: Finding Swing Levels
When a currency pair is following a trend, it is much easier to trade the trend if you identify the possible swing/retrace levels. Price never goes up or down following a straight line. Instead, it makes a leg higher during an uptrend before making a retrace to start the next leg up. It is a good idea to identify where the retraces will end or the swing low levels will fall during an uptrend. This identifies an ideal price point for placing a pending buy order.
First, you should identify what indicator is the trend leaning against. Is it a trend line? Is it a moving average? A Fibonacci level? If the trend is following the Fibonacci pattern then you should identify the Fibonacci levels. This will help you find the swing/retracement levels since the Fibonacci numbers act as support/resistance.
As you can see from the GBP/USD weekly chart below, the Fibonacci numbers have provided three trading opportunities in the direction of the trend and another two trading opportunities in the countertrend direction.
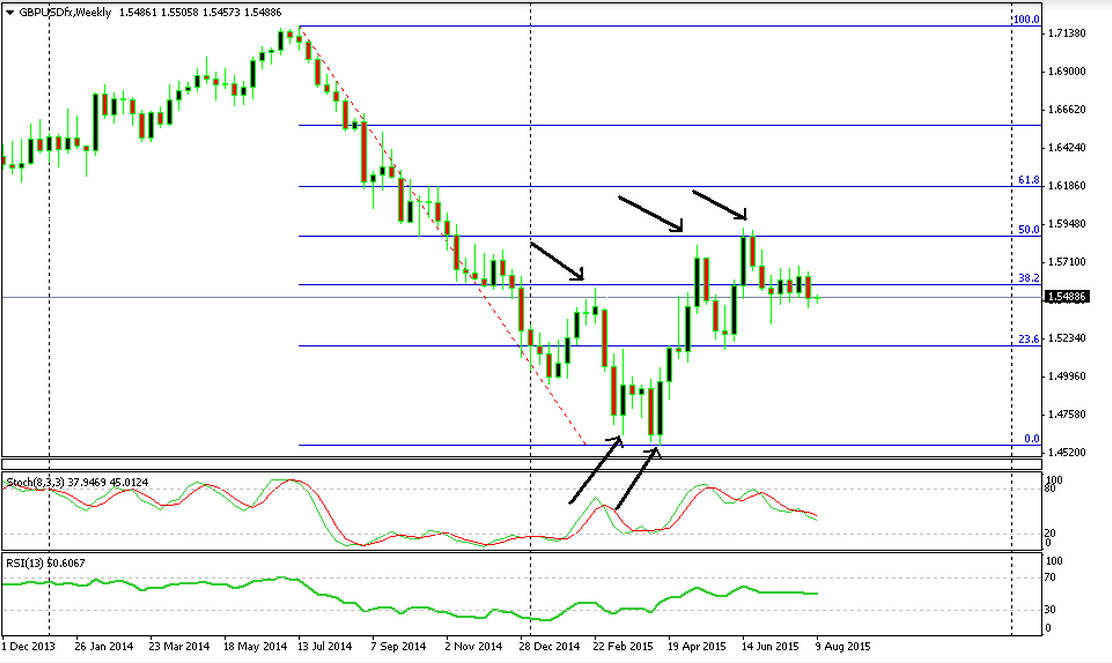
Swing Levels Based On The Fibonacci Golden Ratio Numbers
When the forex price action is leaning against a trend line or a moving average, these indicators reject price when it touches them, acting as swing low levels in an uptrend or vice-versa in a downtrend.
The strength of the trend may not always be the same throughout the course. When the trend is weaker, you should use bigger periodic moving averages or less inclined trend lines to craft a forex price action strategy. When the trend gains pace, you should use the smaller period MAs or the more inclined trend lines as swing low/high levels.
As you can see in the picture below, when the trend is stronger, the 20-MA acts as resistance for the price, and when the trend loses strength, the 50 MA becomes the price rejection line.
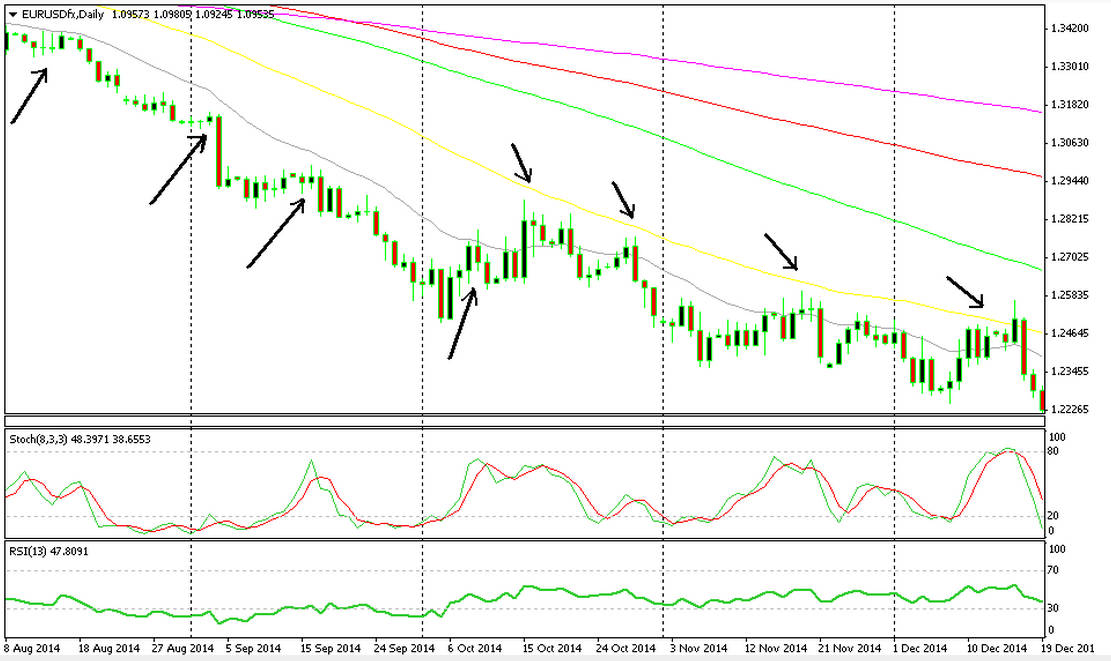
Swing Levels Based On The 20 and 50 MAs
Swing Level Analysis
After identifying swing levels, you have to make a risk/reward analysis of the current retrace. You never know how long a trend will last, so when buying the retraces/swings you should place the take profit near the top of the last high swing. But if the trend is based on a trend line or a moving average (MA) then you should check how far the last swing high went. Is it far enough to give you a good risk/reward ratio, thus justifying a possible trade?
There’s also a higher probability that your trade will be successful if there are a few candles at the top of the last swing. However, if there are many candles at the top it means that the resistance is very strong because it tried many times to break above that level but failed. Therefore, it is safer to enter when there are fewer candles at the top.
On the chart below, we can see that the price easily broke above the top of the last swing which was made of only two candles. We can also see that on the second occasion, where the top is made of several candles, the forex price action couldn’t break above it.
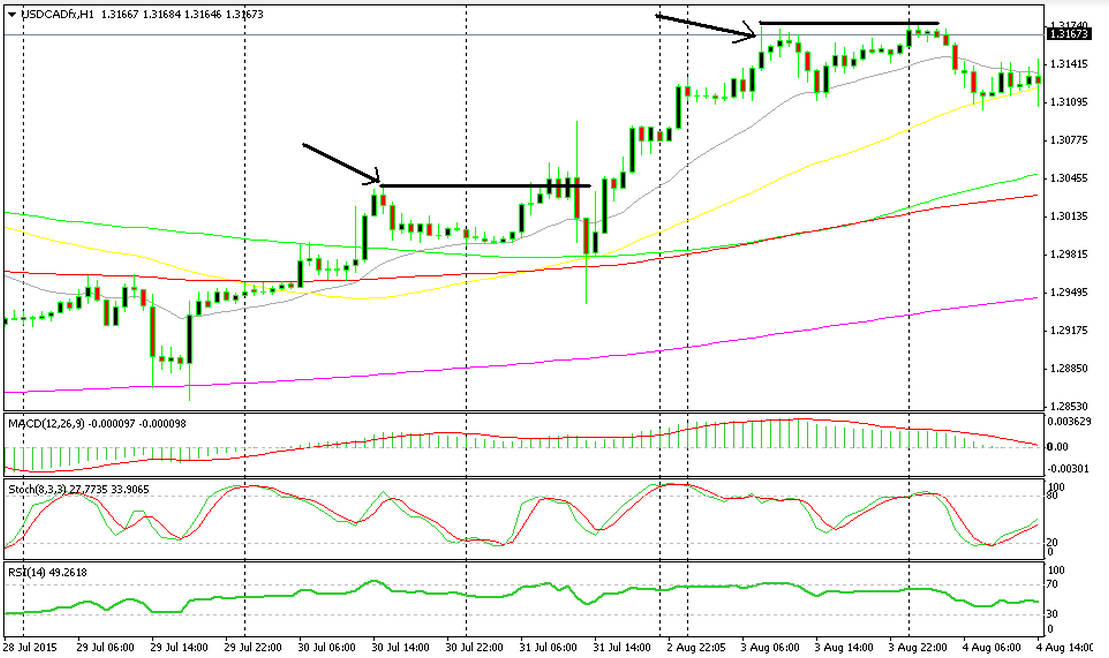
Forex Price Action Strategy: The More Candles At The Top, The Stronger The Resistance
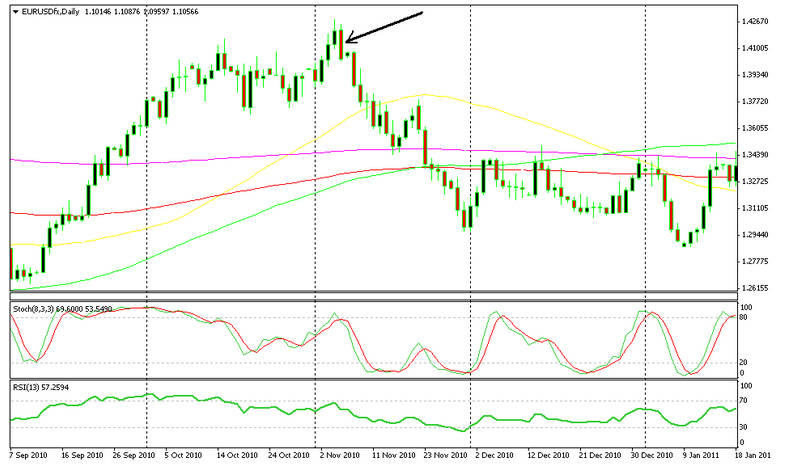
Retrace Strength
Once you have identified swing levels in a trend, you should find out how strong the retraces are. If we are planning to buy the retrace in an uptrend we want it to be weak because a strong retrace might take price deeper, triggering the stop loss. In fact, strong retraces often turn into trend reversals because the bulls get scared, closing their long positions after price breaks several support areas. That’s why we should see how price respects the indicator that the trend is based on.
If price has often pierced the trend line or the MA in the past, it means that the retraces are quite strong. In this case, it is better to stay away because a reversal might take place at any time. We should also see how quickly the price has reversed in the past. If during the past retraces price has reversed quickly without sticking to the trend line or MA, then the bulls have an appetite for risk and the retraces are weak. Therefore, it’s safe to buy in on the retraces.
The chart below shows two phases down trending forex price action: in the first phase, the price respects the 50 MA on which the trend is leaning against. The price reverses down whenever it touches or gets close to the MA. The retraces are weak, and it is safe to sell. On the second part, price clearly breaches the 50 MA in yellow. Although it goes back below it, it’s not advisable to sell the retraces anymore because the trend might reverse anytime now that the retraces have become stronger. We see that the downtrend does reverse later on.
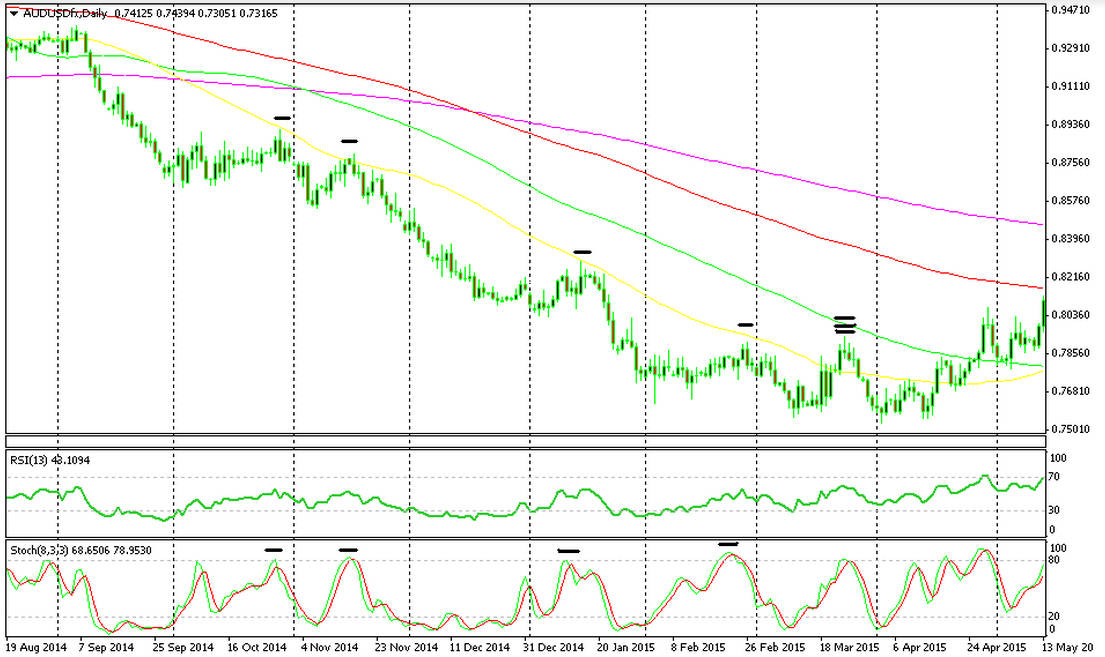
The Weaker The Retrace, The Stronger The Trend
Current Price Action Strategies: Rejection Time
This one a primary forex price action strategy. It is crucial for trading because the rejection time shows us how fast certain levels are rejecting the price.
After several attempts at the 1.0930-55, the EUR/USD chart below gives the impression of quick rejections because of the long wicks. In truth, this may not be the case. Price may have stayed at the top of the wick for almost the entire time, only to drop at the last minute before the candles closed. That is why you have to observe the price in real-time in order to see how quickly it reversed from the top. It is a bit time consuming, but you have to put in the effort to succeed in this business. If the price only spikes to the top for a moment, and then quickly reverses back down, it means that a lot of sellers are waiting to sell at that level. This makes it a very strong resistance, thus a very safe place to open a sell position.
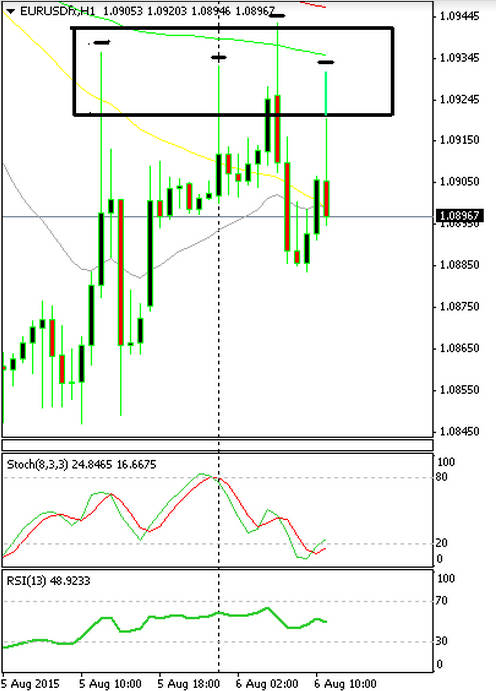
You Have To Observe Forex Price Action Closely To See How Quickly Price Reverses From The Top
Big Opposing Candles/Doji/Pin/Hammers
Candlestick chart formations are current price action strategies that require you to observe the price and trade as the pattern takes place. This is unlike the past price action strategies where you must identify the swing low/high levels and leave a sell/buy pending order.
During a trend, candles might be of different sizes and shapes. Yet, when a trend has run its course, one of the signs that a reversal is imminent is a big opposing candle. Quite often at the end of a trend, we see a big candle take place in the direction of the trend followed by an opposing candle of similar size. What does this mean? It means that the bears in a downtrend have had a last go at a level, pushing the price further. In response, the bulls jump right back in and take price to the level where the previous candle opened. This means that buyers have finally matched sellers. In this case, the sellers added more shorts or took profit on the ones that were already open. Both of these actions led to a trend reversal.
The same logic applies to dojis, pins, and hammers. In the case of a downtrend, when the opposing candle is bigger than the previous one, the pattern is called a bullish engulfing pattern. It is a strong signal of a pending trend reversal since the buyers have outnumbered the sellers. Observe forex price action closely when you see that one of these patterns taking place. Then get ready to buy or sell because a reversal is taking place right in front of you.
A Bearish Engulfing Candle Leads To A Trend Reversal
Narrow Range Candles
When the price moves in a narrow range it creates small candles. On such occasions, the buyers and sellers haven’t made up their mind yet and have let go of their positions after making small gains. When this happens you should observe price, because these patterns lead to some explosive moves and you don’t want to be absent when it happens.
After one party makes up its mind and breaks the range, even slightly, the others get scared and remove all orders. This creates a liquidity hole which allows the price to move directionally without any resistance. You can make two trades out of this pattern; either enter immediately as the narrow range breakout occurs and/or enter again when the price reverses back to test the range.
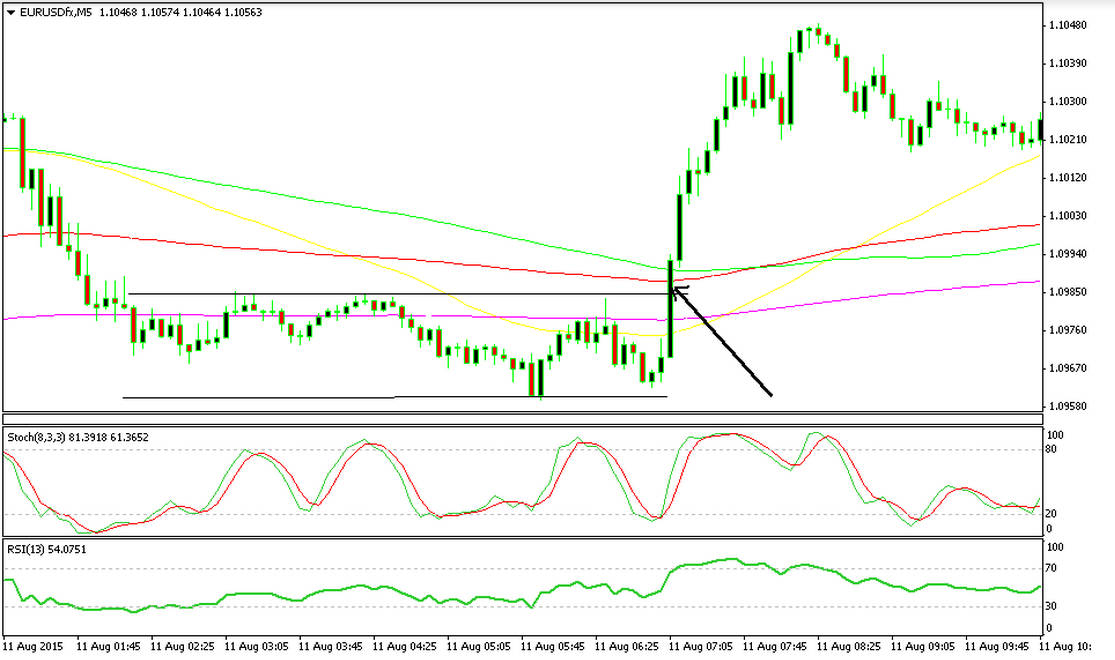
Narrow Range Candles Are Often Followed By Large Moves
Getting Started With Forex Price Action
These are some of the most common methods to understand, read and trade based on price action. Price action trading tells you the mindset of the market and how basic human emotions, like fear and greed, play out in forex trading. It shows the important levels where the buyers or sellers don’t have the nerve to take the price above or below.
AvaTrade - Tsim Kev Ua Lag Luam Nrog Cov Lag Luam-Kev Lag Luam Dawb
- Qhov tso nyiaj tsawg kawg nkaus tsuas yog 250 USD kom tau txais kev nkag mus rau tag nrho cov VIP channel
- Tau Txais Qhov Zoo Tshaj Plaws Ntiaj Teb MT4 Forex Broker
- Them 0% rau txhua qhov CFD seev
- Ntau txhiab tus CFD cov cuab tam los ua lag luam
- Qiv chaw muaj
- Them nyiaj sai sai nrog daim debit / credit card
Price action trading, when combined with a few other indicators, can be a very profitable way to engage the markets. We hope the strategies explained in this article will help you identify some good trading opportunities and stock your trading account with an abundance of green pips.