
Hana no ke kālepa kope. ʻO kā mākou Algo e wehe a pani i nā kālepa.
Hāʻawi ka L2T Algo i nā hōʻailona waiwai nui me ka liʻiliʻi liʻiliʻi.
24/7 kālepa cryptocurrency. I kou hiamoe ʻana, kālepa mākou.
10 mau minuke hoʻonohonoho me nā pōmaikaʻi nui. Hāʻawi ʻia ka manual me ke kūʻai.
79% Laki holomua. ʻO kā mākou hopena e hoʻohauʻoli iā ʻoe.
A hiki i 70 kālepa i kēlā me kēia mahina. Loaʻa ma mua o 5 mau pai.
Hoʻomaka nā kau inoa o kēlā me kēia mahina ma ka £58.
Nā Kūlana Kiʻi
Nā pae kū'ē: 4710, 4760, a me 4800
Support Levels: 4560,4530 and 4500
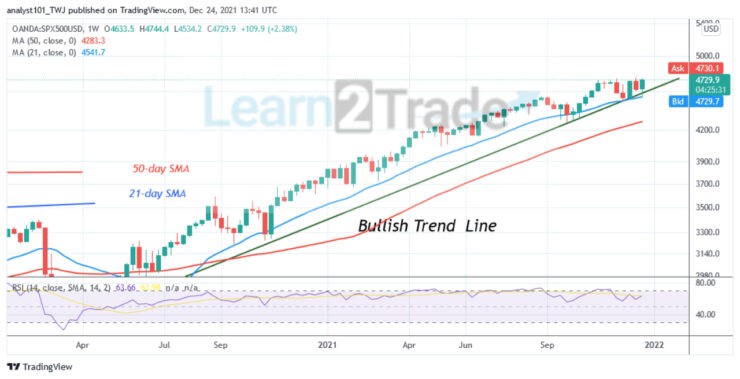
Kumukuai S&P 500 Loihi Kau: Bullish
S&P 500 has been in an upward move amidst false breakouts. The market reached the high of level 4714.40. The index price is above the moving averages indicating a possible upward movement of prices. Since November 1, the uptrend has been terminated as the index resumed a sideways move. On November 22, S&P 500 fell to the low of level 4492 and resumed upward. Today, the bulls have broken above the resistance level but are facing another rejection at level 4730.
Heluhelu ʻia nā hōʻailona pakuhi o kēlā me kēia pule:
S&P 500 is at level 63 of the Relative Strength Index for period 14. It indicates that the index is in the uptrend zone and it is capable of rising. The 21-day line and the 50-day line moving averages are sloping upward indicating the uptrend. The uptrend is ongoing as long as the trend line remains unbroken. The 21-day line moving average is regarded as the support level.
S&P 500 Medium-term Au: Kaulana
On the 4 – hour chart, S&P 500 is in a sideways trend. Buyers have failed to keep the index price above the overhead resistance. Since December 12, the market has encountered three false breakouts. For instance, on December 23, the bulls have broken above the overhead resistance level. The market reached level 4744 and was repelled. This has been the price action since November.
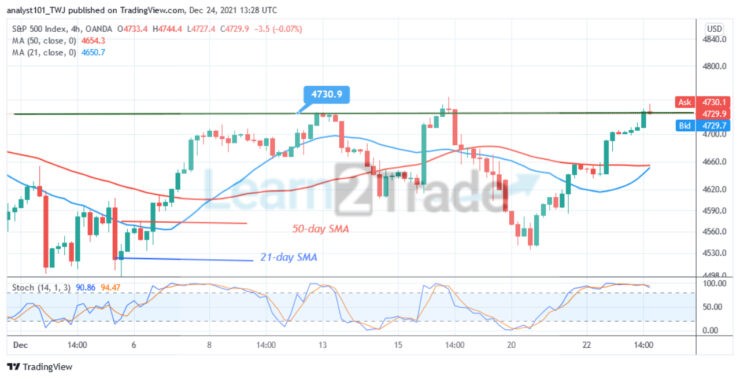
4 -Hour Chart Indicators Reading
S&P 500 is above the 80% range of the daily stochastic. It indicates that the market is in the overbought region. Further upward movement of prices is unlikely as sellers emerge in the overbought region. S&P 500 may decline below the overhead resistance. The 21-day and the 50-day lines moving average are sloping horizontally indicating a sideways trend.
Nānā Nui no S&P 500
S&P 500 is in a sideways trend amidst false breakouts. Buyers have failed to sustain the bullish momentum above the overhead resistance. Consequently, the range-bound move will continue for a few days.
Hiki iā ʻoe ke kūʻai i nā kālā crypto ma aneʻi: Kūʻai Kālā
palapala aie: E aʻo2. ʻAʻole ʻo Market he aʻoaʻo aʻoaʻo kālā. E hana i kāu noiʻi ma mua o ka hoʻopukapuka ʻana i kāu kālā i kekahi waiwai kālā a i hōʻike ʻia i ka huahana a hanana paha. ʻAʻole mākou kuleana no kāu hopena hopena hoʻopukapuka
- Broker
- Min Kāle
- manual
- E kipa aku iā Broker

- Paepae kālepa Cryptocurrency lanakila lanakila
- Waihona palena iki $ 100,
- Kau ʻia ʻo FCA & Cysec

- 20% bonus bonus mai $ 10,000
- Ke waiho liʻiliʻiʻuʻuku $ 100
- Hōʻoia i kāu moʻokāki ma mua o ka loaʻa ʻana o ka bonus

- Ma luna o 100 nā huahana kālā ʻokoʻa
- Hoʻopukapuka mai kahi $ 10 wale nō
- Hiki ke huki i ka lā like
- ʻO nā kumukūʻai kūʻai haʻahaʻa
- 50% Welcome Bonus
- Kākoʻo 24 Hour lanakila lanakila
- ʻO ka waihona Moneta Markets Fund me ka palena iki o $ 250
- Koho i ka hoʻohana ʻana i ka palapala e koi ai i kāu bonus 50% waiho