
Tsjinst foar kopiearjen hannel. Us Algo iepenet en slút hannels automatysk.
De L2T Algo leveret heul profitable sinjalen mei minimaal risiko.
24/7 cryptocurrency hannel. Wylst jo sliepe, hannelje wy.
10 minuten opset mei substansjele foardielen. De hânlieding wurdt foarsjoen mei de oankeap.
79% súkses rate. Us útkomsten sille jo opwekke.
Oant 70 hannelingen per moanne. D'r binne mear as 5 pearen beskikber.
Moanlikse abonneminten begjinne by £ 58.
Wichtichste fersetssônes: 35000, 35500, 36000
Key Support Sones: 27000, 26500, 26000
US Wall Street 30 (US30USD) Trends op lange termyn: Bearish
De US Wall Street 30 is in a downtrend as it may revisit level 31241. Today, the index fell below the moving average lines but found support above the 50-day moving average line. When the 50-day line SMA is breached, the selling pressure will resume. The index made an upward correction on December 16, and a candle body tested the 61.8% Fibonacci retracement level. The correction forecasts that the US30USD will fall to 1.618 Fibonacci extensions, or 31241.20.
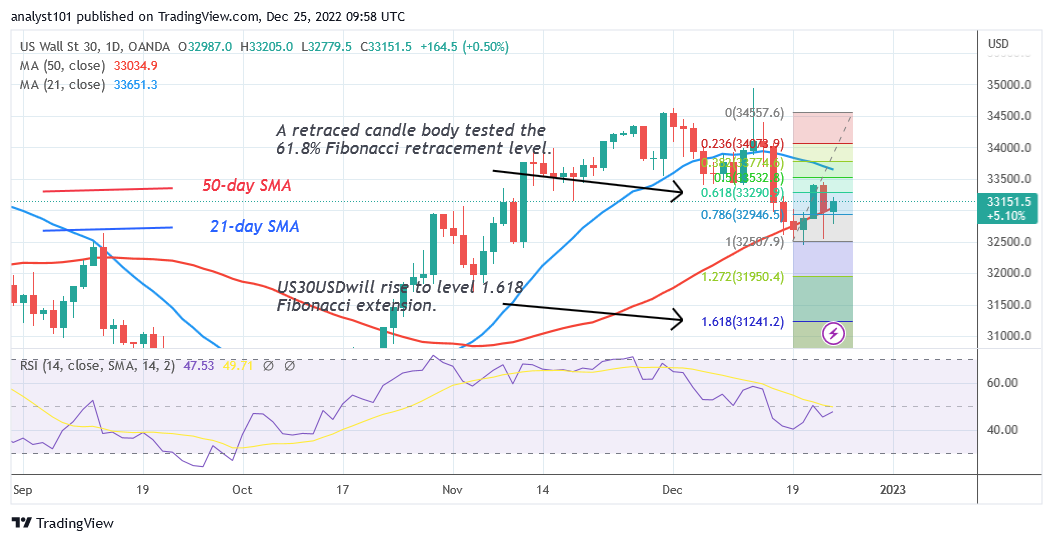
US Wall Street 30 Daily Chart Indicators Lêze:
On the Relative Strength Index for period 14, the US30USD is trading at level 47. The price bars are positioned between the moving average lines, indicating a potential range bound move. A downtrend is indicated by the northward slant of moving average lines.
US Wall Street 30 (US30USD) Trend op 'e lange termyn: Bearish
The US30USD is in a downtrend on the 4-hour chart, but it is correcting upward. The 50-day line SMA is repelling the upward correction. Buyers are also defending the current resistance level above 32400. The index made an upward correction on December 16, and a candle body tested the 61.8% Fibonacci retracement level. The correction forecasts that the US30USD will fall to 1.618 Fibonacci extensions, or level 31555.10.
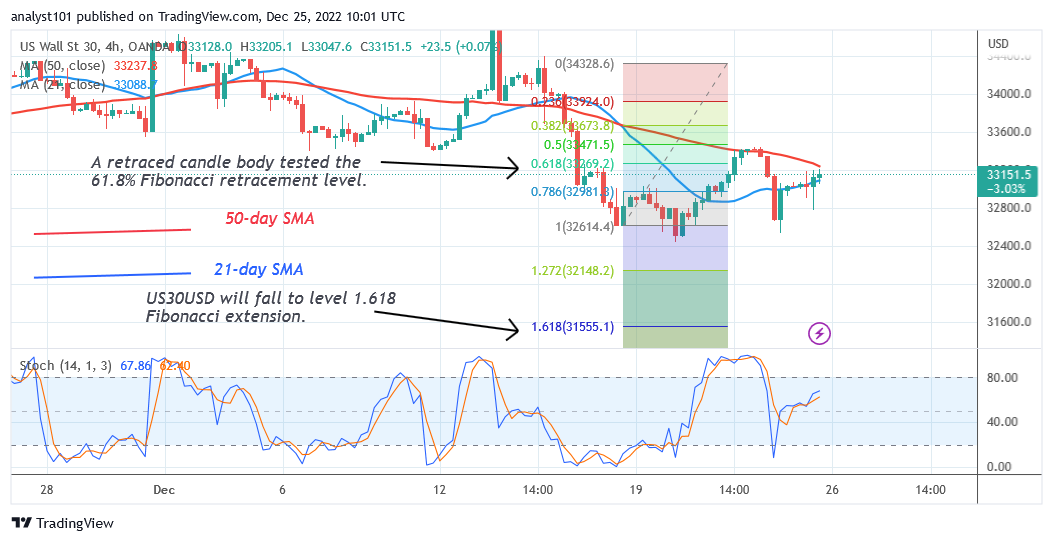
4-oere grafyske yndikatoaren lêze
The US30USD is rising above the daily stochastic’s level 40. As long as the price is between the moving average lines, the market may resume its range bound movement. The 21-day and 50-day simple moving averages are falling, indicating a decline.
Algemien Outlook foar US Wall Street 30 (US30USD)
The US30USD is likely to fall further as it may revisit level 31241. On the 4-hour chart, the index has broken through the current support three times. The US Wall Street 30 is currently moving in a range between the moving average lines.
Jo kinne hjir kryptomunten keapje: Keapje LBLOCK
Noat: Learn2Trade is gjin finansjeel adviseur. Doch jo ûndersyk foardat jo jo fûnsen ynvestearje yn alle finansjele aktiva as presinteare produkt as evenemint. Wy binne net ferantwurdlik foar jo ynvestearringsresultaten
- Broker
- Min boarchsom
- Skoare
- Besykje Broker

- Bekroand kryptovaluta-hannelsplatfoarm
- Minimale boarch fan $ 100,
- FCA & Cysec regele

- 20% wolkombonus fan maksimaal $ 10,000
- Minimale boarch $ 100
- Ferifiearje jo akkount foardat de bonus wurdt byskreaun

- Mear dan 100 ferskate finansjele produkten
- Ynvestearje fan mar $ 10
- Ynlûking fan deselde dei is mooglik
- Fûns Moneta Markets -akkount mei in minimum fan $ 250
- Meld jo oan mei it formulier om jo 50% boarchbonus op te easkjen