
Tsjinst foar kopiearjen hannel. Us Algo iepenet en slút hannels automatysk.
De L2T Algo leveret heul profitable sinjalen mei minimaal risiko.
24/7 cryptocurrency hannel. Wylst jo sliepe, hannelje wy.
10 minuten opset mei substansjele foardielen. De hânlieding wurdt foarsjoen mei de oankeap.
79% súkses rate. Us útkomsten sille jo opwekke.
Oant 70 hannelingen per moanne. D'r binne mear as 5 pearen beskikber.
Moanlikse abonneminten begjinne by £ 58.
BNBUSD-priisanalyse - 19 desimber
The ability to break up the resistance level of $31 will expose the price to $33 and $37 price levels. In case the support level of $31 is defended by the bears, the price may reverse and continue its bearish movement towards the support levels of $29, $26 and $24.
BNB / USD Merke
Key nivo's:
Oanbiedingsnivo's: $ 31, $ 33, $ 37
Fraachnivo's: $ 29, $ 26, $ 24
BNBUSD Lange termyntrend: Bullish
BNBUSD is bullish on the long-term outlook. There was a bearish breakout that took place two weeks ago from the symmetrical triangle formed on the daily chart. The price tested the support level of $26 but unable to penetrate. A bullish engulfing candle formed and this triggered the bulls’ momentum. The price increases and $29 price level was broken upside. At the moment, the price is trying to break up the resistance level of $31.
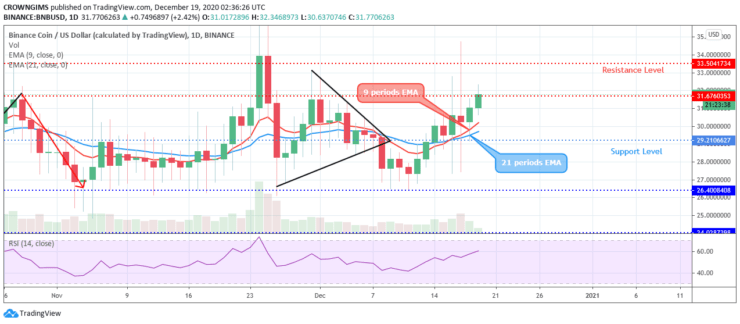
The 9 periods EMA is currently above the 21 periods EMA and the coin is trading above the two EMAs at a distance which indicates an increase in the bulls’ momentum. The ability to break up the resistance level of $31 will expose the price to $33 and $37 price levels. In case the support level of $31 is defended by the bears, the price may reverse and continue its bearish movement towards the support levels of $29, $26 and $24. The Relative Strength Index period 14 is bending up at 60 levels connotes buy signal.
BNBUSD middellange termyn Trend: Bullish
The bears were unable to break down the support level of $26 after the breakout that occurred from the triangle in the BNB market last two weeks. The bulls successfully defend the support level of $26 and the price bounces and rally towards the north. The resistance level of $29 could not hold the price, breaks it up and increases to $31 price level.
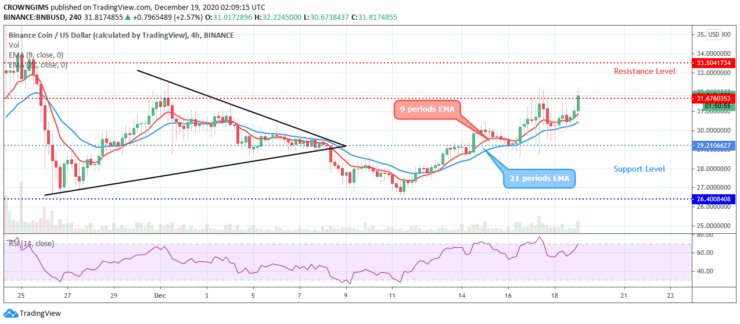
The 9 periods EMA has crossed the 21 periods EMA upside, and it is trading above the 9 periods EMA which indicates increase in the buyers’ pressure. Meanwhile, the relative strength index period 14 is at 70 levels pointing up to indicate a buy signal.
Opmerking: Learn2.Trade is gjin finansjeel adviseur. Doch jo ûndersyk foardat jo jo fûnsen ynvestearje yn alle finansjele aktiva as presinteare produkt as evenemint. Wy binne net ferantwurdlik foar jo ynvestearringsresultaten
- Broker
- Min boarchsom
- Skoare
- Besykje Broker

- Bekroand kryptovaluta-hannelsplatfoarm
- Minimale boarch fan $ 100,
- FCA & Cysec regele

- 20% wolkombonus fan maksimaal $ 10,000
- Minimale boarch $ 100
- Ferifiearje jo akkount foardat de bonus wurdt byskreaun

- Mear dan 100 ferskate finansjele produkten
- Ynvestearje fan mar $ 10
- Ynlûking fan deselde dei is mooglik
- Fûns Moneta Markets -akkount mei in minimum fan $ 250
- Meld jo oan mei it formulier om jo 50% boarchbonus op te easkjen