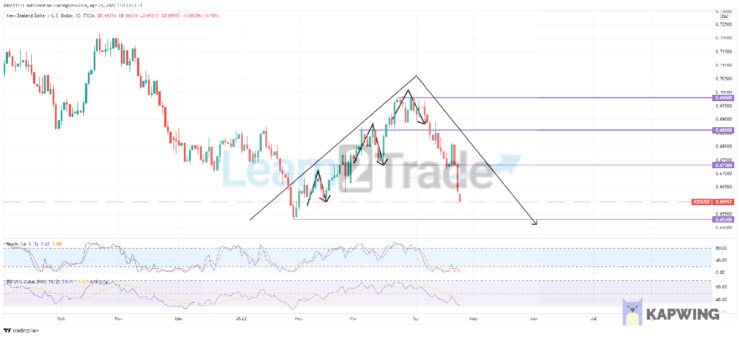
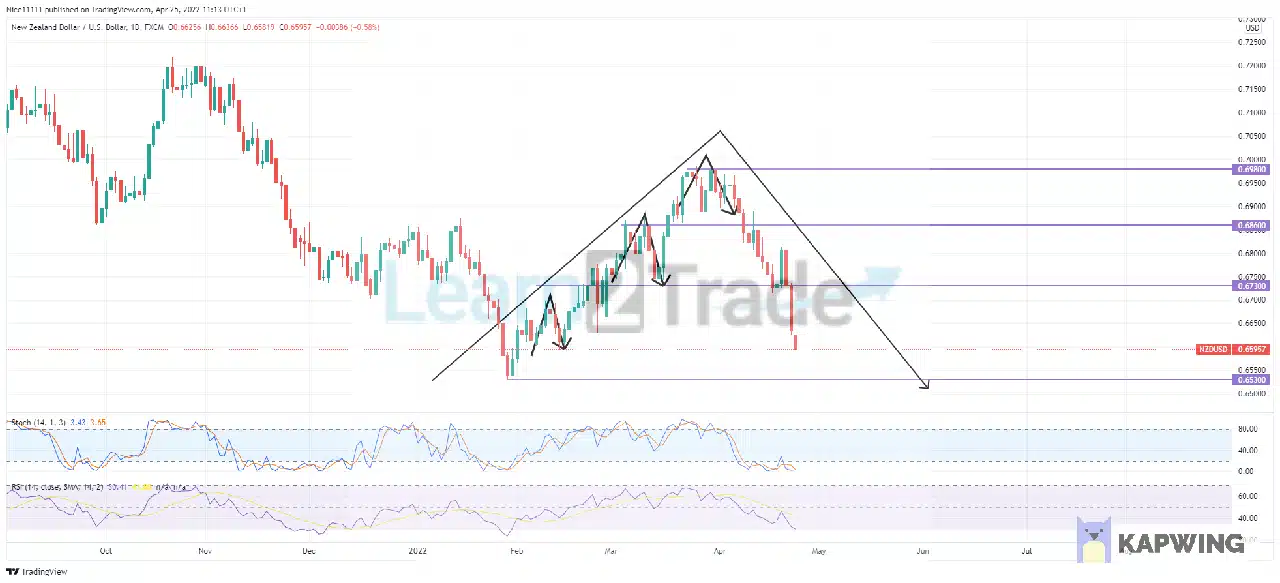
NZDUSD creates a balance between the buy and sell sides of the market. The overall buy-side drive was initiated at the 0.6530 demand zone. The bulls impulsively crashed into the demand zone from the 20th of January till the 28th of January, when the demand zone was reached. The Relative Strength Index and the Stochastic indicated that the market was oversold. The bulls utilized the opportunity to go long in the market at the support level.
There was buy-side, and sell-side momentum fulfilled before the overall high was reached after the market took off from 0.6530. Three major circles of buy-side and sell-side drives were completed before overall resistance was faced at 0.6980. The first circle was initiated on February 7th with “three rising soldiers.” “Three Black Crows” completed the sell-side as well. The sell-side ended on the 14th of February after a swing high on the 10th of February. The second circle of buy-side and sell-side momentum that was fulfilled started with the bearish candle on March 1, 2022. The market created a double top pattern to signify a reversal to fulfil the sell-side run.
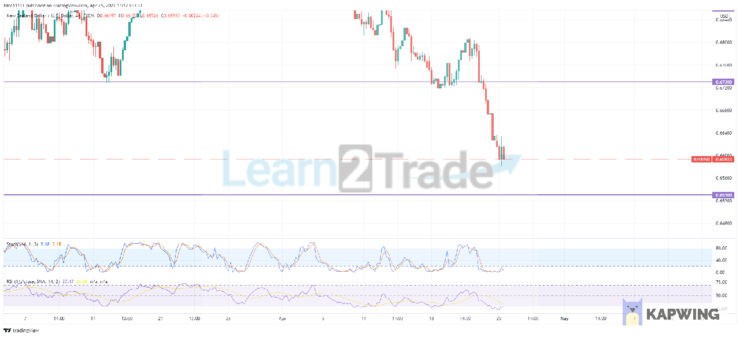
Two large bearish candles dived into 0.6730 to fulfil the sell-side run. The market created the last bullish run of the overall buy-side momentum from the demand zone at 0.6730 to the resistance at 0.6980. The last circle of buy-side and sell-side momentum that was fulfilled created the overall reversal to initiate the overall sell-side momentum. The Stochastic indicator and the Relative Strength Indicator indicated that the market was in an oversold region. The market experienced difficulty passing through 0.6980. On the 8th of April, the market violated the previous lows of the bullish trend at 0.6860. The structural market shift significantly signals the initiation of the sell-side in the market.
NZDUSD Short Term Trend: Bearish
The bears seek to dive the market to 0.6530. The market has been heavily bearish in the last few days of trading. The zone at 0.6530 is almost reached. The Stochastic indicator and the relative strength indicator indicate that the market is already oversold. Therefore, the market is expected to reverse after reaching 0.6530 to target the next major level at 0.6730.
Note:Learn2.trade is not a financial advisor. Do your research before investing your funds in any financial asset or presented product or event. We are not responsible for your investing results.
Trade on MT4 with Leverage up to 1:500! Trade on MT4 with Leverage up to 1:500!
X
We use cookies to ensure that we give you the best experience on our website. If you continue to use this site we will assume that you are happy with it.OkPrivacy policy