
Servo por kopikomerco. Nia Algo aŭtomate malfermas kaj fermas komercojn.
La L2T Algo provizas tre enspezigajn signalojn kun minimuma risko.
24/7 komerco de kripta monero. Dum vi dormas, ni komercas.
10-minuta aranĝo kun grandaj avantaĝoj. La manlibro estas provizita kun la aĉeto.
79% Sukcesprocento. Niaj rezultoj ekscitos vin.
Ĝis 70 komercoj monate. Estas pli ol 5 paroj disponeblaj.
Monataj abonoj komenciĝas je 58 £.
Ŝlosilniveloj
Rezistaj Niveloj: 4710, 4760, kaj 4800
Support Levels: 4560,4530 and 4500
S&P 500 Prezo Longtempa Tendenco: Alcista
S&P 500 has been in an upward move amidst false breakouts. The market reached the high of level 4714.40. The index price is above the moving averages indicating a possible upward movement of prices. Since November 1, the uptrend has been terminated as the index resumed a sideways move. On November 22, S&P 500 fell to the low of level 4492 and resumed upward. Today, the bulls have broken above the resistance level but are facing another rejection at level 4730.
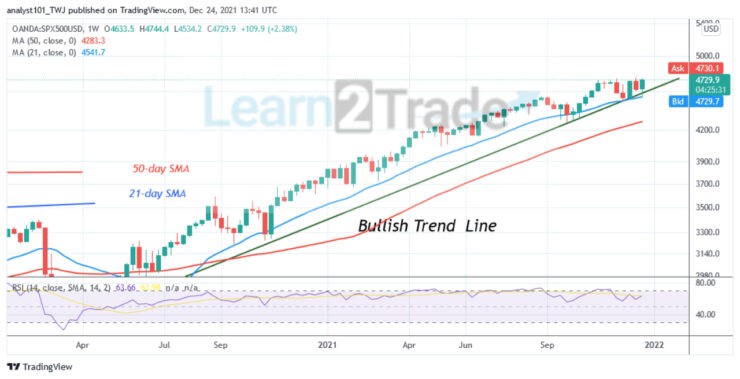
Legado de Semajnaj Grafikaj Indikiloj:
S&P 500 is at level 63 of the Relative Strength Index for period 14. It indicates that the index is in the uptrend zone and it is capable of rising. The 21-day line and the 50-day line moving averages are sloping upward indicating the uptrend. The uptrend is ongoing as long as the trend line remains unbroken. The 21-day line moving average is regarded as the support level.
S&P 500 Meztempa Tendenco: Varianta
On the 4 – hour chart, S&P 500 is in a sideways trend. Buyers have failed to keep the index price above the overhead resistance. Since December 12, the market has encountered three false breakouts. For instance, on December 23, the bulls have broken above the overhead resistance level. The market reached level 4744 and was repelled. This has been the price action since November.
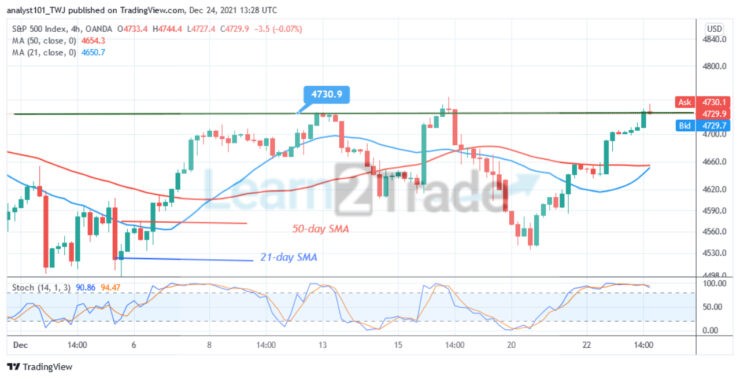
4 -Hour Chart Indicators Reading
S&P 500 is above the 80% range of the daily stochastic. It indicates that the market is in the overbought region. Further upward movement of prices is unlikely as sellers emerge in the overbought region. S&P 500 may decline below the overhead resistance. The 21-day and the 50-day lines moving average are sloping horizontally indicating a sideways trend.
Ĝenerala Perspektivo por S&P 500
S&P 500 is in a sideways trend amidst false breakouts. Buyers have failed to sustain the bullish momentum above the overhead resistance. Consequently, the range-bound move will continue for a few days.
Vi povas aĉeti kriptajn monerojn ĉi tie: Aĉetu Monerojn
noto: Learn2.Trade ne estas financa konsilisto. Faru vian esploron antaŭ ol investi viajn financojn en iu ajn financa valoraĵo aŭ prezentita produkto aŭ evento. Ni ne respondecas pri viaj investaj rezultoj
- makleristo
- Min Deponejo
- partituro
- Vizitu Broker

- Premiita komerca platformo Kripta monero
- $ 100 minimuma deponejo,
- FCA & Cysec reguligita

- 20% bonvena gratifiko ĝis $ 10,000
- Minimuma deponejo $ 100
- Kontrolu vian konton antaŭ ol la krono estas kreditita

- Konto de Moneta Markets kun minimumo de $ 250
- Elektu uzi la formularon por postuli vian 50% -deponan gratifikon