
Service for copy trading. Our Algo automatically opens and closes trades.
The L2T Algo provides highly profitable signals with minimal risk.
24/7 cryptocurrency trading. While you sleep, we trade.
10 minute setup with substantial advantages. The manual is provided with the purchase.
79% Success rate. Our outcomes will excite you.
Up to 70 trades per month. There are more than 5 pairs available.
Monthly subscriptions begin at £58.
Bitcoin (BTC) Price Analysis: Daily Chart – Bullish
Key resistance levels: $9700, $9900, $10200, $10500
Key support levels: $9200, $9000, $8800, $8600
The daily chart presents a bullish trend for Bitcoin with the current price at $9434. The last three days price increase was characterized by a bullish candle which is now becoming choppy. This suggests that buying pressure is getting weak as the $10000 proves tough for the market to overcome, although $9800 is near support for the market.
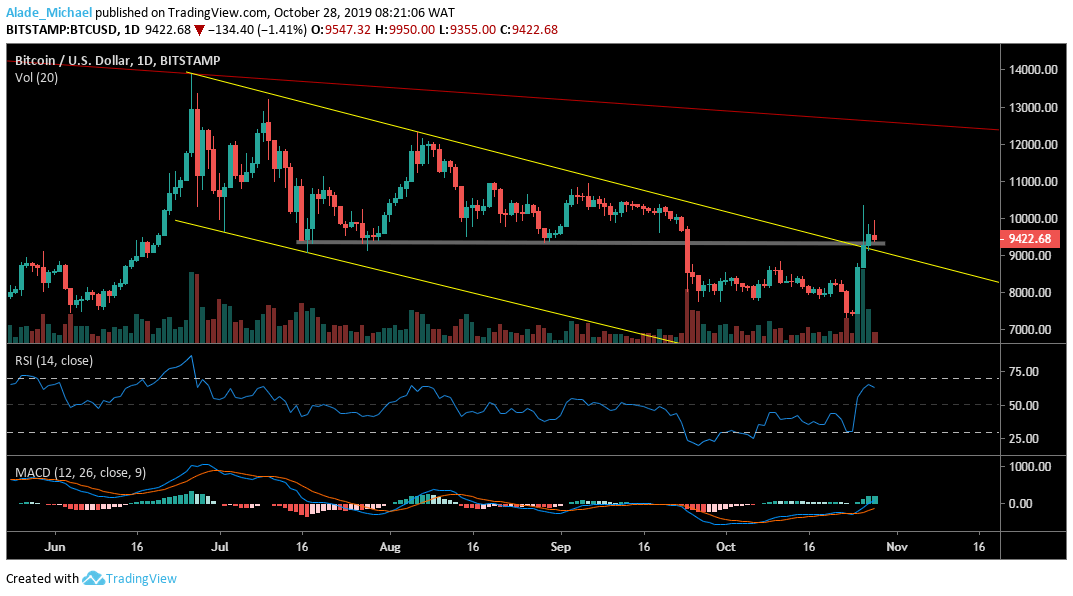
If we can close above the $10000 today, Bitcoin’s price will proceed to $10200 and $10500 in no time. For now, immediate support lies at $9200. A daily close beneath $9000 may keep price back in a consolidation mode, testing $9800 and $9600. While the RSI shows that the bulls are present, the MACD revealed that the bulls are yet to gain momentum. A crossover should confirm a strong bullish momentum for Bitcoin.
Bitcoin (BTC) Price Analysis: Hourly Chart – Bullish
Bitcoin is breaking out of the triangle pattern after subduing with choppy price actions for two days. The bulls are losing momentum as the bears regroup back on a short-term. We may see a serious drop to $9200, $9000 and $8800 support if the supply becomes heavy. The interesting thing is that the technical RSI and MACD signal a bearish divergence. Considering the current reversal pattern, BTC is expected to lose value in the next few hours.
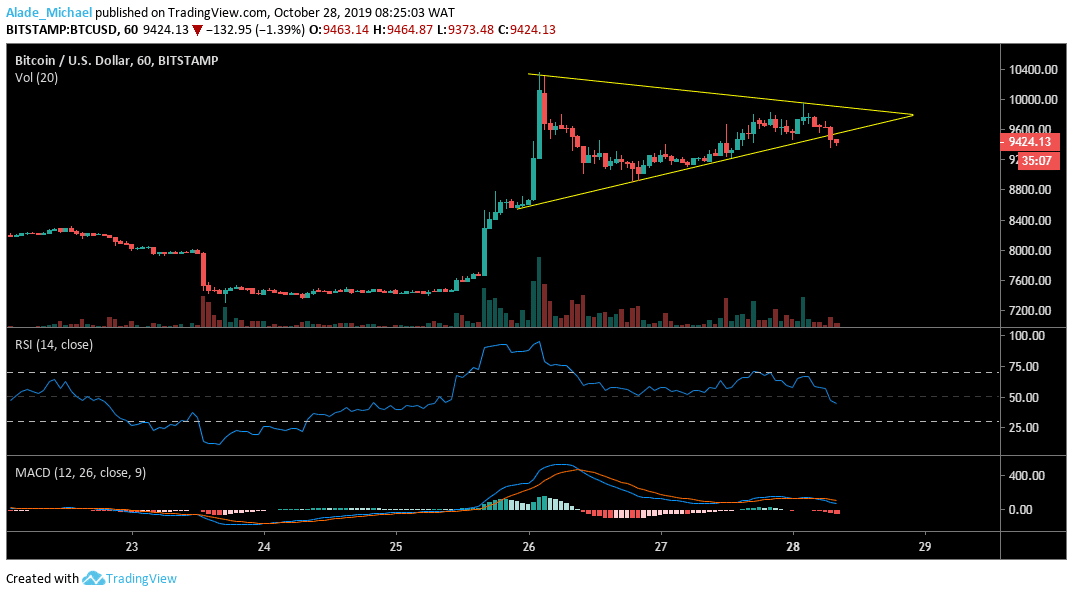
Meanwhile, Bitcoin’s price can be unpredictable at times as we may see a bullish continuation amidst the bearish signal. In case of a false breakout, we may see a sharp rise to $10400 but the nearest resistance lies at $9600, $9800 and $10000. However, the short-traders seemed to be opening a position now.
BITCOIN SELL SIGNAL
Sell Entry: $9477
TP: $9100
SL: $10000
- Broker
- Min Deposit
- Score
- Visit Broker

- Award-winning Cryptocurrency trading platform
- $100 minimum deposit,
- FCA & Cysec regulated

- 20% welcome bonus of upto $10,000
- Minimum deposit $100
- Verify your account before the bonus is credited

- Over 100 different financial products
- Invest from as little as $10
- Same-day withdrawal is possible
- Fund Moneta Markets account with a minimum of $250
- Opt in using the form to claim your 50% deposit bonus